Thorium

Thorium is a highly scalable, distributed malware analysis and data generation framework. Thorium is designed to make cyber incident response, triage, and file analysis easier through the safe ingestion and storage of data, automation of analyses and easy access to stored analyses and metadata. Because of the sensitivity and potential maliciousness of data handled within Thorium, uploaded files are placed into an encrypted/neutered format called CaRT. After initial file upload, all analysis is conducted in sandboxed environments where protective measures and sanitization steps can be easily applied.
Getting Started

This guide will cover how to start using Thorium to analyze data at scale.
Most tasks in Thorium can be accomplished in both the Web UI and our command line tool called Thorctl (pronounced Thor-cuddle). The interface you choose to use will depend on the number of samples or repositories you are working with and whether a browser client is accessible within your own analysis environment. If you need to analyze hundreds or thousands of samples, you can utilize Thorctl to upload the data, run analysis jobs, and download then results of those jobs. Thorctl is also useful when working on a “headless” analysis environment where only a command line interface is at your disposal. Alternatively, the Web UI provides an easy way to upload, analyze, and view a smaller number of samples and repos for those with access to a browser client. The Web UI also provides the ability create groups and modify group membership.
If you have already registered for a Thorium account you can skip to the Login section of this chapter.
Registering For A New Thorium Account
Before you can login to Thorium you need to register for an account. This can be done through the Web UI by clicking the register button on the login page. Then enter your username and password. If your Thorium instance is using LDAP then use your LDAP password, otherwise you may create your new password here.
Logging Into Thorium
Most tasks in Thorium require you to be authenticated. Both the Web UI and Thorctl will also require occasional reauthentication as your token or cookie expires. The following videos demonstrate how to use our two client interfaces to login to your Thorium account.
Web UI
You will automatically be sent to the login page when you initially navigate to Thorium using your browser, or when your token expires while browsing Thorium resources. To login via the Web UI, just enter your username and password as shown in the video below and then click login. Once you (re)login, you will automatically be redirected to your home page for a new login, or back to your previous page in the case of an expired cookie.
Thorctl
To login with Thorctl you will first need to download the executable. To download Thorctl, follow one of the guides below based on your operating system type.
Download
Linux/Mac
Run this command on the Linux system that you want Thorctl to be installed on.
Windows
Download Thorctl from this Windows Thorctl link.
Login
After you have downloaded Thorctl you can authenticate to Thorium by running:
Enter your username and password when prompted and you should get a success message as shown below:
Roles, Permissions, and Ownership
Thorium uses groups to grant access to resources and role-based permissions to limit the ability of individuals to conduct certain operations on those resources.
Resource Ownership and Access
All resources within Thorium including files and analysis pipelines are owned by the person that created them,
but uploaded to a group. Only group members and those with the Admin system role can access a group’s resources or
even know that a particular resource like a file has been uploaded. This explicit groups-based access model helps to
prevent information leakage and supports multitenancy of the Thorium system. Different groups can use the same Thorium
instance without risking sensitive data being leaked across groups. In order for a user to have access to resources,
such as files, the user can be added to that resource’s group or the resource can be reuploaded to one of the user’s
existing groups.
Roles
Roles within Thorium are scoped at two different levels: System and Group. The capabilities granted by Group roles
apply to resources within a specific group while System roles apply globally.
System Roles
System roles primarily exist to limit individuals from conducting certain sensitive actions at a global level. Since
anyone with a Thorium account can create their own groups, there is no practical way to limit certain actions using
only Group roles.
A Thorium account will only have one System role at a time: User, Developer, or Admin. When you first register
for an account, you are granted the User system role by default. This will allow you to conduct analysis within
Thorium, but does not allow you to create new analysis pipelines or give you any privileged access to data outside of
your groups. If your interactions with Thorium require you to add or modify existing pipelines or tools (called
images), you will need a Thorium Admin to give you the Developer role. The Developer role is considered a
privileged role because it effectively allows an account holder to execute arbitrary binaries/commands within
Thorium’s sandboxed analysis environments.
The Thorium Admin role grants access to view and modify all resources within Thorium, irrespective of the resource’s
group. In contrast, a User or Developer must still have the correct group membership and group role if they plan on
using the resources of that group. Each Thorium deployment should have at least one person with the Admin system role.
Admins help to curate the data hosted in Thorium and provide continuity when group members leave the hosting
organization.
The following table summarizes the abilities granted by Thorium’s three System level roles and any limitations that
apply to those granted abilities:
| System Role | Abilities | Limited By |
|---|---|---|
| User | Can create groups and run existing pipelines, but cannot create or modify pipelines or images. | Must have sufficient group role and group membership |
| Analyst | Can create groups, and can add, modify, and run analysis pipelines and images. Has global view into all data in Thorium. | None |
| Developer | Can create groups, and can add, modify, and run analysis pipelines and images. | Must have sufficient group role and group membership |
| Admin | Can access, view, and modify all resources, change group membership and update System and Group roles. | None |
You can view your System role on the profile page, as shown below.
Group Roles
Group roles control your ability to conduct certain operations on the group’s resources. Group resources can include
images, pipelines, repos, files, tags, comments, and analysis tool results.
There are four group roles: Owner, Manager, User, and Monitor. Anyone with a Thorium account can create their
own groups. When you create a new group, you are automatically added as an Owner of the group. When you are added to
an existing group your role within the group will be assigned. Group roles and their associated capabilities are
defined in the following table.
| Ability | Owners | Managers | Users | Monitors |
|---|---|---|---|---|
| View Resources | yes | yes | yes | yes |
| Run Pipelines | yes | yes | yes | no |
| Upload/Create Resources1 | yes | yes | yes | no |
| Modify Resources1 | all | all | self created only | no |
| Delete Resources | all | all | self created only | no |
| Group Membership | add/remove any member | add/remove non-owner members | read only | read only |
| Delete Group | yes | no | no | no |
-
For pipelines and images this ability also requires a
DeveloperorAdminSystemlevel role. Without the correctSystemrole, you will not be able to modify or create pipelines or images even if you have the correct group role (Owner,Manager, orUser). However, you will still be able to run existing pipelines that otherDevelopershave added so long as you are not aMonitor. ↩ ↩2
Creating/Editing Groups
All resources within Thorium including files, analysis pipelines, and tools are owned by a user and uploaded to a group. Access to modify group resources is granted by your role within the group. If you want to learn more about Thorium’s roles and permissions system, you can read this page. The ability to manage group membership and create new groups is only available in Thorium’s Web UI.
WebUI
To create a new group follow the steps in the following video:
You may have noticed that you can add users to different group roles. As we described in the previous chapter, group roles are how you define the abilities a group member has within the group. Roles and their abilities are defined in the table below. Group resources can include images, pipelines, repos, files, tags, comments, and tool results.
| Ability | Owners | Managers | Users | Monitors |
|---|---|---|---|---|
| View Resources | yes | yes | yes | yes |
| Run Pipelines | yes | yes | yes | no |
| Upload/Create Resources | yes | yes | yes | no |
| Modify/Delete Resources | all | all | self owned only | none |
| Group Membership | add/remove any member | add/remove non-owner members | no | no |
| Delete Group | yes | no | no | no |
A Thorium user can be added to a group either as a direct user or as part of a metagroup. This functionality allows you to use an external group membership system (ie LDAP/IDM) to grant access to Thorium resources.
| type | description |
|---|---|
| direct user | A single user in Thorium |
| metagroups | A group of users that is defined in LDAP |
By default, metagroup info is updated every 10 minutes or when a Thorium group is updated. This means that when a user is added or removed from a metagroup it may take up to 10 minutes for that change to be visible in Thorium via the Web UI.
Thorctl
Thorctl is a command line tool aimed at enabling large scale operations within Thorium. Thorctl provides a variety of features including:
- uploading files
- uploading Git repositories
- ingesting Git repositories by URL
- downloading files/repos
- starting reactions/jobs
- starting Git repo builds
- downloading results
- listing files
An example of some of these can be found in the Users section of these docs.
To install Thorctl, follow the instructions for your specific operating system in the sections below.
Linux/Mac
On a Linux or Mac machine, open a terminal window and run the following command:
Insecure Download
- Although not recommended, you can bypass certificate validation and download Thorctl insecurely
by adding the
-k(insecure) flag tocurland--insecureat the very end of the command (see the command below for reference). The former tellscurlto download the script itself insecurely while the latter will informs the script to use insecure communication when downloading Thorctl.
Windows
Download Thorctl from the following link: Windows Thorctl
Login Via Thorctl
After you have downloaded Thorctl, you can authenticate by running:
Configure Thorctl
Logging into Thorium using thorctl login will generate a Thorctl config file containing the
user’s authentication key and the API to authenticate to. By default, the config is stored
in <USER-HOME-DIR>/.thorium/config.yml, but you can manually specify a path like so:
thorctl --config <PATH-TO-CONFIG-FILE> ...
The config file can also contain various other optional Thorctl settings. To easily modify the config
file, use thorctl config. For example, you can disable the automatic check for Thorctl updates
by running:
thorctl config --skip-updates=true
You can specify a config file to modify using the --config flag as described above:
thorctl --config <PATH-TO-CONFIG-FILE> config --skip-updates=true
Proxy Settings
By default Thorctl respects proxy settings from the environment
(HTTP_PROXY/HTTPS_PROXY/ALL_PROXY, honoring NO_PROXY). You can override this in the
client block of the config:
client:
  # Disable all proxies and connect directly, ignoring the environment (default: false)
  disable_proxy: false
  # Route all traffic through an explicit proxy (may embed credentials,
  # e.g. http://user:pass@host:port). Takes precedence over the environment.
  proxy: http://proxy.example.com:8080
  # Comma-separated hosts/domains/CIDRs that bypass the explicit `proxy`
  # (mirrors NO_PROXY; only applies when `proxy` is set).
  no_proxy: localhost,cluster.local
These can also be set with thorctl config:
thorctl config --proxy http://proxy.example.com:8080 --no-proxy localhost,cluster.local
thorctl config --disable-proxy=true
thorctl config --clear-proxy
Thorctl Help
Thorctl will print help info if you pass in either the -h or --help flags.
$ thorctl -h
The command line args passed to Thorctl

Usage: thorctl [OPTIONS] <COMMAND>

Commands:
  clusters   Manage Thorium clusters
  login      Login to a Thorium cluster
  files      Perform file related tasks
  reactions  Perform reactions related tasks
  results    Perform results related tasks
  repos      Perform repositories related tasks
  help       Print this message or the help of the given subcommand(s)

Options:
      --admin <ADMIN>      The path to load the core Thorium config file from for admin actions [default: ~/.thorium/thorium.yml]
      --config <CONFIG>    path to authentication key files for regular actions [default: ~/.thorium/config.yml]
  -k, --keys <KEYS>        The path to the single user auth keys to use in place of the Thorctl config
  -w, --workers <WORKERS>  The number of parallel async actions to process at once [default: 10]
  -h, --help               Print help
  -V, --version            Print version
Each subcommand of Thorctl (eg files) has its own help menu to inform users on the available options for that
subcommand.
$ thorctl files upload --help
Upload some files and/or directories to Thorium

Usage: thorctl files upload [OPTIONS] --file-groups <GROUPS> [TARGETS]...

Arguments:
  [TARGETS]...  The files and or folders to upload

Options:
  -g, --groups <GROUPS>            The groups to upload these files to
  -p, --pipelines <PIPELINES>      The pipelines to spawn for all files that are uploaded
  -t, --tags <TAGS>                The tags to add to any files uploaded where key/value is separated by a deliminator
      --deliminator <DELIMINATOR>  The deliminator character to use when splitting tags into key/values [default: =]
  -f, --filter <FILTER>            Any regular expressions to use to determine which files to upload
  -s, --skip <SKIP>                Any regular expressions to use to determine which files to skip
      --folder-tags <FOLDER_TAGS>  The tags keys to use for each folder name starting at the root of the specified targets
  -h, --help                       Print help
  -V, --version                    Print version
Users
The Thorium user role is the default role for any newly created Thorium account. Thorium users can range from incident responders to malware reverse engineers or vulnerability researchers. With this role you can:
- upload files and Git repositories
- add and remove metadata tags on uploaded files and repositories
- run a pipeline on a file or repository (called a reaction)
- view reaction status and logs
- view tool results
- comment on files and upload comment attachments
- create new groups
Permissions that users do not have:
- create or modify tools (images) or pipelines
If you need to create or modify analysis pipelines, you may need to ask the admins of your Thorium instance to add you as a Developer.
Uploading Files
Now that you have access to Thorium, you may want to upload some files and run analysis tools on them. You can do that in either the Web UI or through Thorctl. When uploading a small number of files, the Web UI is usually preferable, while Thorctl is helpful in uploading many files or when a browser is not accessible.
When uploading files there are several options you may set that are described below. Groups is the only required
field. If you are not yet a member of any groups then follow the steps in the
Adding/Editing Groups section and come back afterward.
| Field | Description | Format/Accepted Values | Required |
|---|---|---|---|
| Groups | Limits who can see this file | One or more group names | yes |
| Description | A short text explanation of the sample and/or its source | Any valid UTF-8 formatted text | no |
| Tags | Key/value pairs to help locate and categorize files | Any key/value pair; both key and value are required | no |
| Origins | Specifies where a file came from | Downloaded, Transformed, Unpacked, Wire, Incident, or Memory Dump | no |
It is recommended that you provide origin information for any file(s) you upload whenever possible. A key feature of Thorium is its ability to store origin information in a structured format and automatically translate that information into metadata tags. Tags allow you to filter the files that you browse through when looking for a file. As a result, if you don’t provide any origin information, it may be difficult to locate your files at a later date.
File Origins
File Origins are the single most important piece of information in describing, locating, and understanding relationships
between files. Described below are all the options for file origins and their respective subfields.
Downloaded
The “Downloaded” Origin specifies that the file was downloaded from a specific URL.
| Subfield | Description | Format/Accepted Values | Required |
|---|---|---|---|
| URL | The URL the file was downloaded from | A valid URL | yes |
| Site Name | The name of the website the file was downloaded from | Any UTF-8 formatted text | no |
Transformed
The “Transformed” Origin specifies that the file is a result of transforming another file, whether by a tool or some other means.
| Subfield | Description | Format/Accepted Values | Required |
|---|---|---|---|
| Parent | The SHA256 of the original file that was transformed to produce this file | A valid SHA256 of an existing file in Thorium1 | yes |
| Tool | The tool that was used to produce this transformed file | Any UTF-8 formatted text | no |
| Flags | The tool command-line flags that were used to transform this sample | One or more hyphenated alphanumeric flags2 | no |
- Your account must have access to the parent file in order to specify it in a file’s origin
- Example:
--flag1, --flag2, --flag3, -f
Unpacked
The “Unpacked” Origin specifies that the file was unpacked from some other file, whether by a tool or some other means.
| Subfield | Description | Format/Accepted Values | Required |
|---|---|---|---|
| Parent | The SHA256 of the original file that this file was unpacked from | A valid SHA256 of an existing file in Thorium1 | yes |
| Tool | The tool that was used to unpack this file | Any UTF-8 formatted text | no |
| Flags | The tool command-line flags that were used to unpack this sample | One or more hyphenated alphanumeric flags2 | no |
- Your account must have access to the parent file in order to specify it in a file’s origin
- Example:
--flag1, --flag2, --flag3, -f
Wire
The “Wire” Origin specifies that a file was captured/sniffed “on the wire” en route to a destination.
| Subfield | Description | Format/Accepted Values | Required |
|---|---|---|---|
| Sniffer | The sniffer1 used to capture this file | Any UTF-8 formatted text | yes |
| Source | The source IP/hostname this file came from when it was sniffed | Any UTF-8 formatted text | no |
| Destination | The destination IP/hostname where this file was headed to when it was sniffed | Any UTF-8 formatted text | no |
- Example:
wireshark
Incident
The “Incident” Origin specifies that the file originated from a specific security incident.
| Subfield | Description | Format/Accepted Values | Required |
|---|---|---|---|
| Incident ID | The name or ID identifying the incident from which the file originated | Any UTF-8 formatted text | yes |
| Cover Term | An optional term for the organization where an incident occurred | Any UTF-8 formatted text | no |
| Mission Team | The name of the mission team that handled the incident | Any UTF-8 formatted text | no |
| Network | The name of the network where the incident occurred | Any UTF-8 formatted text | no |
| Machine | The IP or hostname of the machine where the incident occurred | Any UTF-8 formatted text | no |
| Location | The physical/geographical location where the incident occurred | Any UTF-8 formatted text | no |
Memory Dump
The “Memory Dump” Origin specifies that the file originated from a memory dump.
| Subfield | Description | Format/Accepted Values | Required |
|---|---|---|---|
| Memory Type | The type of memory dump this file originated from | Any UTF-8 formatted text | yes |
| Parent | The SHA256 of the memory dump file in Thorium from which this file originates | A valid SHA256 of an existing file in Thorium1 | no |
| Reconstructed | The characteristics that were reconstructed in this memory dump | One or more UTF-8 formatted strings | no |
| Base Address | The virtual address where the memory dump starts | An alphanumeric memory address | no |
- Your account must have access to the parent file in order to specify it in a file’s origin
Carved
The “Carved” Origin specifies that a file was “carved out” of another file (e.g. archive, memory dump, packet capture, etc.). Unlike “Unpacked,” “Carved” describes a sample that is a simple, discrete piece of another file. It’s extraction can be easily replicated without any dynamic unpacking process.
| Subfield | Description | Format/Accepted Values | Required |
|---|---|---|---|
| Parent | The SHA256 of the original file that was carved to produce this file | A valid SHA256 of an existing file in Thorium1 | yes |
| Tool | The tool that was used to produce this transformed file | Any UTF-8 formatted text | no |
| Carved Origin | The type of file this sample was carved from (and other related metadata) | See below Carved origin subtypes | no |
- Your account must have access to the parent file in order to specify it in a file’s origin
Carved origins may also have an optional subtype defining what type of file the sample was originally carved from. The Carved subtypes are described below:
PCAP
The “Carved PCAP” Origin specifies that a file was “carved out” of a network/packet capture.
| Subfield | Description | Format/Accepted Values | Required |
|---|---|---|---|
| Source IP | The source IP address this file came from | Any valid IPv4/IPv6 | no |
| Destination IP | The destination IP address this file was going to | Any valid IPv4/IPv6 | no |
| Source Port | The source port this file was sent from | Any valid port (16-bit unsigned integer) | no |
| Destination Port | The destination port this file was going to | Any valid port (16-bit unsigned integer) | no |
| Protocol | The protocol by which this file was sent | “UDP”/“Udp”/“udp” or “TCP”/“Tcp”/“tcp” | no |
| URL | The URL this file was sent from or to if it was sent using HTTP | Any UTF-8 formatted text | no |
Unknown
The “Carved Unknown” Origin specifies that a file was “carved out” of an unknown or unspecified file type.
This origin has no other subfields except for the ones from it’s parent “Carved” origin.
Web UI
You can upload files in the Web UI by following the steps shown in the following video:
Run Pipelines
You can choose to immediately run one or more pipelines on your uploaded file by selecting them in the Run Pipelines submenu.
You can also run pipelines on the file later from the file’s page in the Web UI or using Thorctl (see
Spawning Reactions for more info on running pipelines on files).
Thorctl
It is best to use Thorctl when you have a large number of files that you want to upload. Thorctl will eagerly upload
multiple files in parallel by default, and specifying a directory to upload will recursively upload every file within
the directory tree. To upload a file or a folder of files, you can use the following command (using --file-groups/-G
go specify the groups to upload to):
thorctl files upload --file-groups <group> <files/or/folders>
If you have multiple files or folders to upload (e.g. ./hello.txt, /bin/ls, and ~/Documents), you can upload them all
in one command like so:
thorctl files upload -G example-group ./hello.txt /bin/ls ~/Documents
Uploading to Multiple Groups
You can upload to more than one group by placing commas between each group:
thorctl files upload -G <group1>,<group2>,<group3> <file/or/folder>
Or by adding multiple -G or --file-groups flags:
thorctl files upload -G <group1> -G <group2> -G <group3> <file/or/folder>
Uploading with Tags
You can also upload a file with specific tags with the --file-tags or -T flag:
thorctl files upload --file-groups <group> --file-tags Dataset=Examples --file-tags Corn=good <file/or/folder>
Because tags can contain any symbol (including commas), you must specify each tag with its own -file-tags or -T flag rather
than delimiting them with commas.
Filtering Which Files to Upload
There may be cases where you want to upload only certain files within a folder. Thorctl provides the ability to either
inclusively or exclusively filter with regular expressions using the --filter and --skip flags, respectively.
For example, to upload only files with the .exe extension within a folder, you could run the following command:
thorctl files upload --file-groups example-group --filter .*\.exe ./my-folder
Or to upload everything within a folder except for files starting with temp-, you could run this command:
thorctl files upload --file-groups example-group --skip temp-.* ./my-folder
Supply multiple filters by specifying filter flags multiple times:
thorctl files upload --file-groups example-group --filter .*\.exe --filter .*evil.* --skip temp-.* ./my-folder
The filter and skip regular expressions must adhere to the format used by the Rust regex crate. Fortunately, this format is very similar to most other popular regex types and should be relatively familiar. A helpful site to build and test your regular expressions can be found here: https://rustexp.lpil.uk
Hidden Directories
Additionally, if you want to include hidden sub-directories/files in a target directory, use the --include-hidden flag:
thorctl files upload -G example-group ./files --include-hidden
Folder Tags
Thorctl also has a feature to use file subdirectories as tag values with customizable tag keys using the --folder-tags option.
For example, say you’re uploading a directory foo with the following structure:
foo
├── foo1.txt
└── bar
    ├── bar1.txt
    ├── bar2.txt
    ├── baz
        └── baz1.txt
    └── qux
        └── qux1.txt
The foo directory contains five total files spread across three subdirectories. Each tag we provide with --folder-tags
corresponds to a directory from top to bottom (including the root foo directory). So for example, if you run:
thorctl files upload -G example-group foo --folder-tags alpha/beta/gamma
The key alpha would correspond to the foo directory, beta to bar, and gamma to baz and qux. So all
files in the foo directory including files in subdirectories would get the tag alpha=foo, all files in the
bar directory would get the tag beta=bar, and so on. Below is a summary of the files and the tags they
would have after running the above command:
| File | Tags |
|---|---|
| foo1.txt | alpha=foo |
| bar1.txt | alpha=foo, beta=bar |
| bar2.txt | alpha=foo, beta=bar |
| baz1.txt | alpha=foo, beta=bar, gamma=baz |
| qux1.txt | alpha=foo, beta=bar, gamma=qux |
A few things to note:
- Because
/is used to delimit individual folder tag keys, keys cannot have/in them. - Tags correspond to subdirectory levels, not individual subdirectories, meaning files in subdirectories on the same
level will get the same tag key (like
bazandquxabove). - You don’t have to provide the same number of tags as subdirectory levels. Any files in subdirectories deeper than the
number of folder tags will receive all of their parents’ tags until the provided tags are exhausted (e.g. if
quxhad a child directory calledquuxwith a file calledquux1.txt, it would get tags forfoo,bar, andqux, but not forquux). - To skip a directory level, you can simply provide an empty tag key for that level. For example,
--folder-tags a//con filea/b/c/d.txtwould get the tagsa=aandc=cbut no tag forb. - The root
/directory in absolute paths as well as.in relative paths are ignored, so--folder-tags a/bon/a/b/c.txt,./a/b/c.txt, and./a/./b/./c.txtwould all have tagsa=aandb=b. Note that..components (e.g.a/b/../b/c.txt) are not ignored.
Adjust Number of Parallel Uploads
By default, Thorctl can perform a maximum of 10 actions in parallel at any given time. In the case of file uploads, that means
a maximum of 10 files can be uploaded concurrently. You can adjust the number of parallel actions Thorctl will attempt to conduct
using the --workers/-w flag:
thorctl --workers 20 files upload --file-groups <group> <files/or/directories>
Viewing Files
Once you have uploaded files to Thorium, you will likely want to view them and any tool results. This can be done in either the Web UI or by using Thorctl.
Web UI
You can find files by either going to the file browsing page as shown the video below or by searching using Thorium’s full text search which will be discussed more later. To view a files details simple click on it.
If you want to filter the files that are listed you can do that by changing the filter settings. Currently Thorium supports groups, submission date ranges, and a single key/value tag as filters. Tag key/values are case sensitive. Multi-tag filtering of files and tag normalization are both planned features that will improve file browsing.
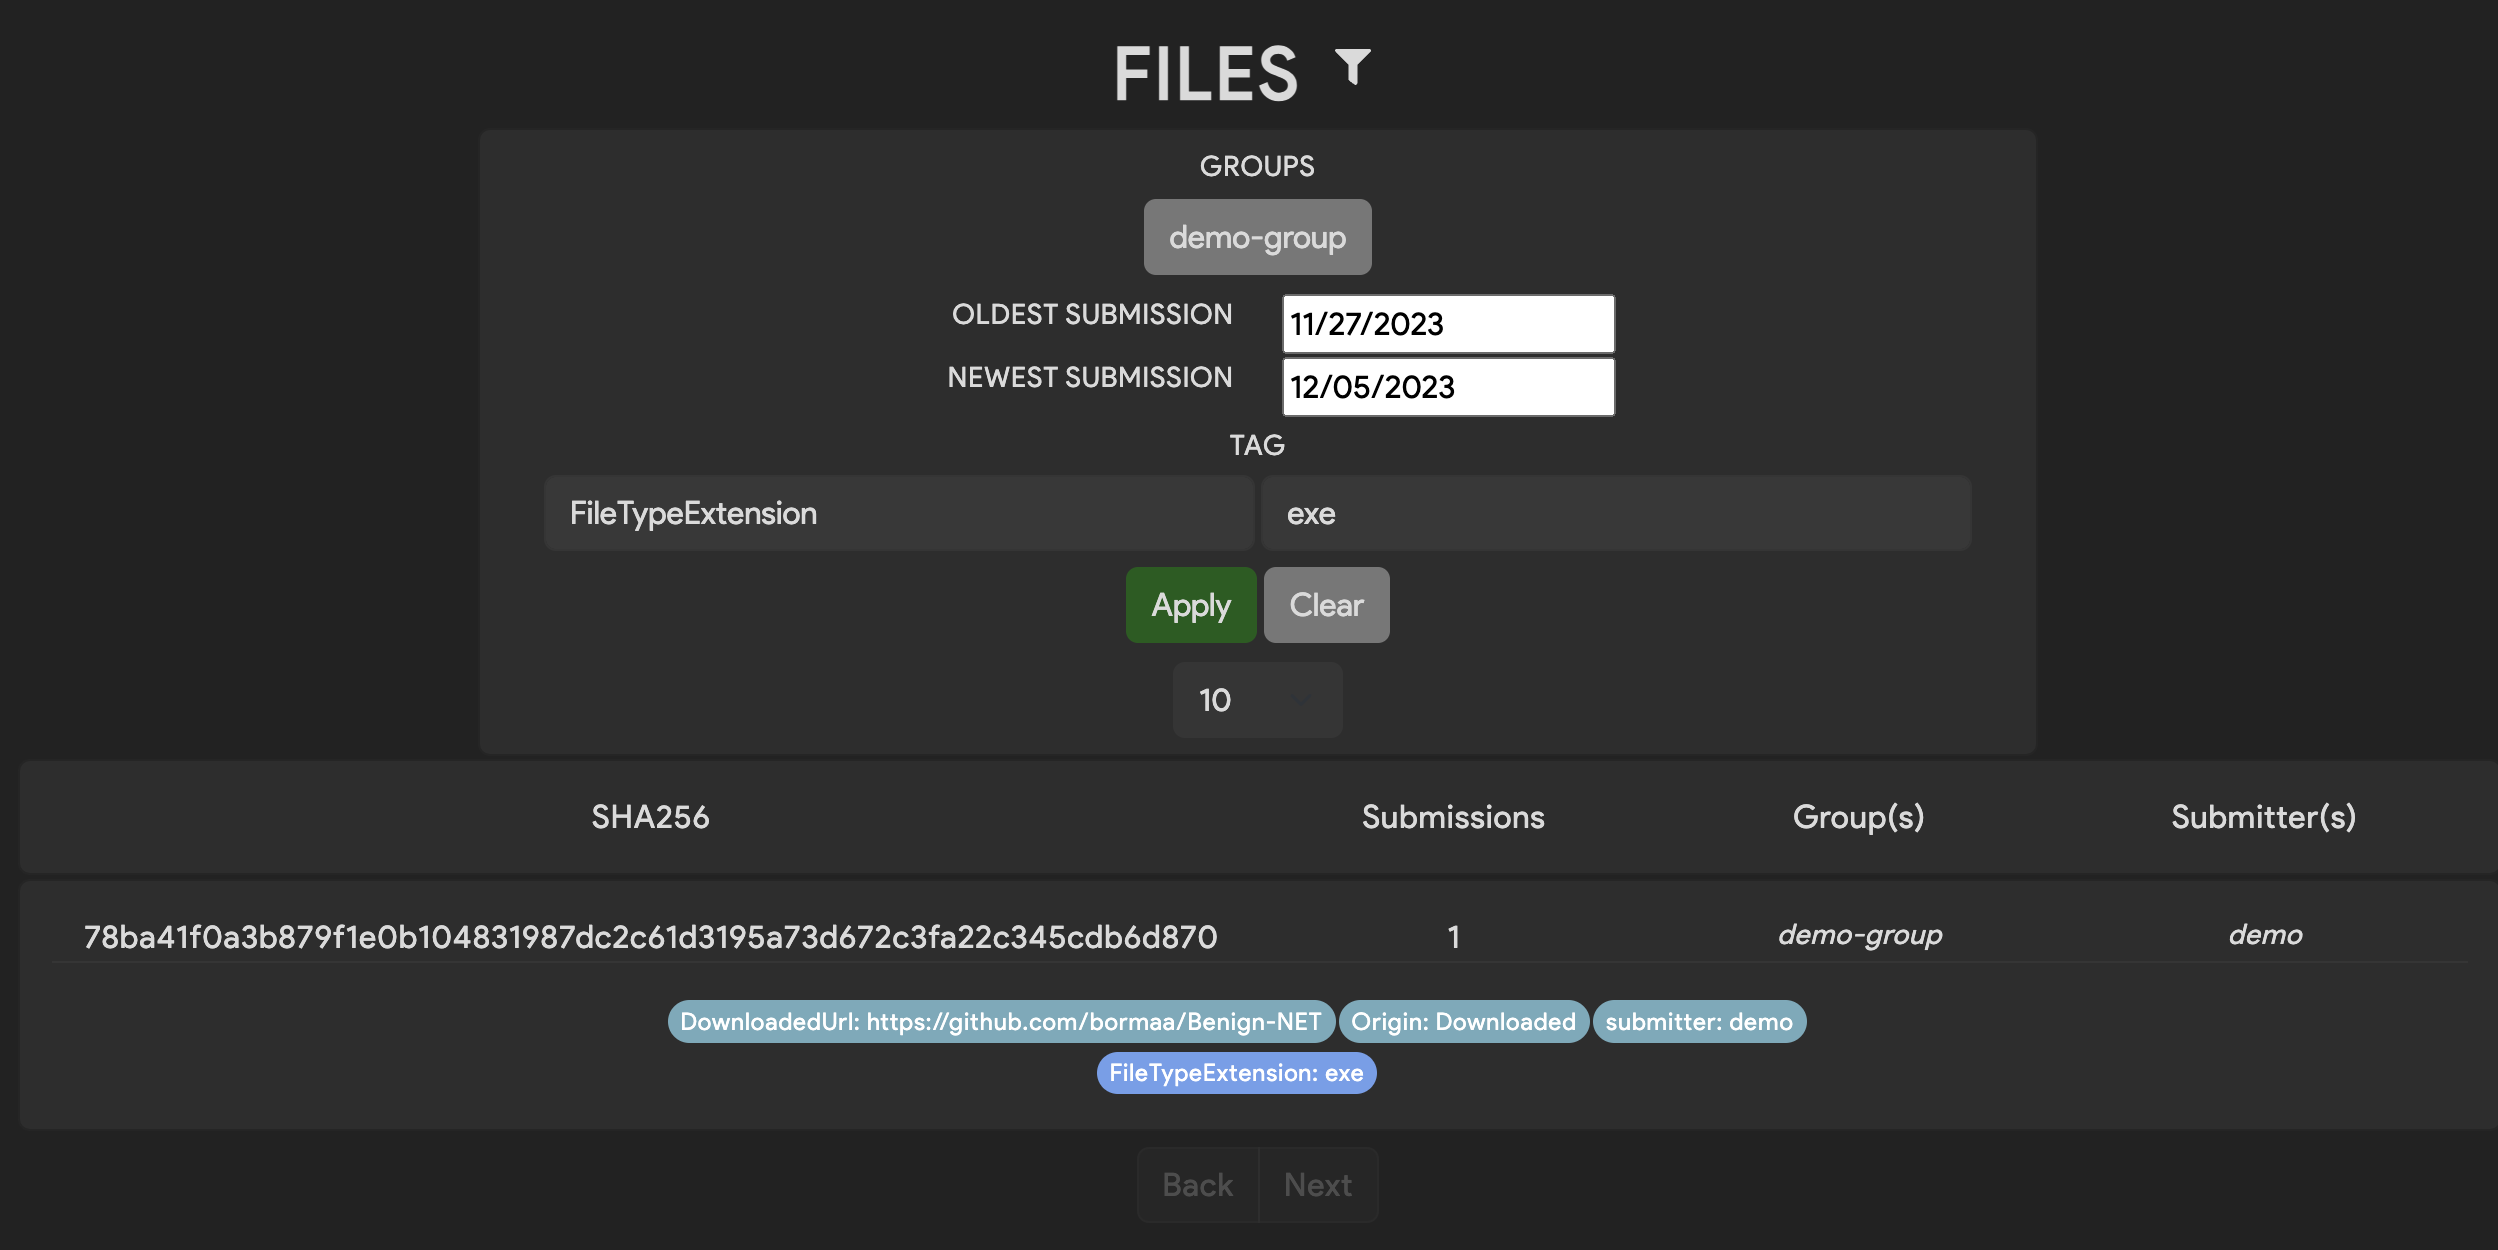
You may notice that your files do not currently have many tags or results that can be used for filters. This is likely because we haven’t run many tools on these files. Running analysis tools on files will be covered in the spawning reactions section.
Thorctl
You can also view a list of files in Thorium using Thorctl. To do that that run the following command:
thorctl files get
The default maximum limit of files to be displayed is 50. You can change the limit by specifying the -l/--limit flag:
thorctl files get --limit 100
Filter by Group
Get a list of files belonging to a certain group or groups by adding the -g/--groups flag. Specify multiple groups by
separating each group with a comma:
thorctl files get --groups examples,shared
Filter by Tag
Get a list of files having certain tags by adding the -t/--tags flag. Unlike groups, tags must be specified each with
a separate flag, as the tags themselves may contain commas or other delimiting symbols:
thorctl files get --tags Dataset=Examples --tags Corn=good
Describe a File
Display all details of particular file in a JSON-like format by using the following command, supplying the file’s
SHA256 hash in place of the <SHA256> placeholder:
thorctl files describe <SHA256>
Tagging Files
Tags are metadata key/value pairs that are used to label the files and repositories that Thorium ingests. These labels make it easier for users and tools to find data that is stored in Thorium. It also helps users understand the data at a glance. Fields like file type, compiler, and origin info can all be tagged to better document the provenance of your data. Tags can be added when a file or repo is initially uploaded, ingested by the agent when a tool is run on that file, or added later by a Thorium user manually through the Web UI.
Tag values may contain any UTF-8 characters including symbols (e.g. Language=C++), characters from other languages (e.g. CountryOfOrigin=Україна), or even emojis (e.g. Status=✅).
Tags are currently case sensitive, but tag normalization (standardizing capitalization of existing tags in a Thorium instance) is a planned to be added in future versions of Thorium.
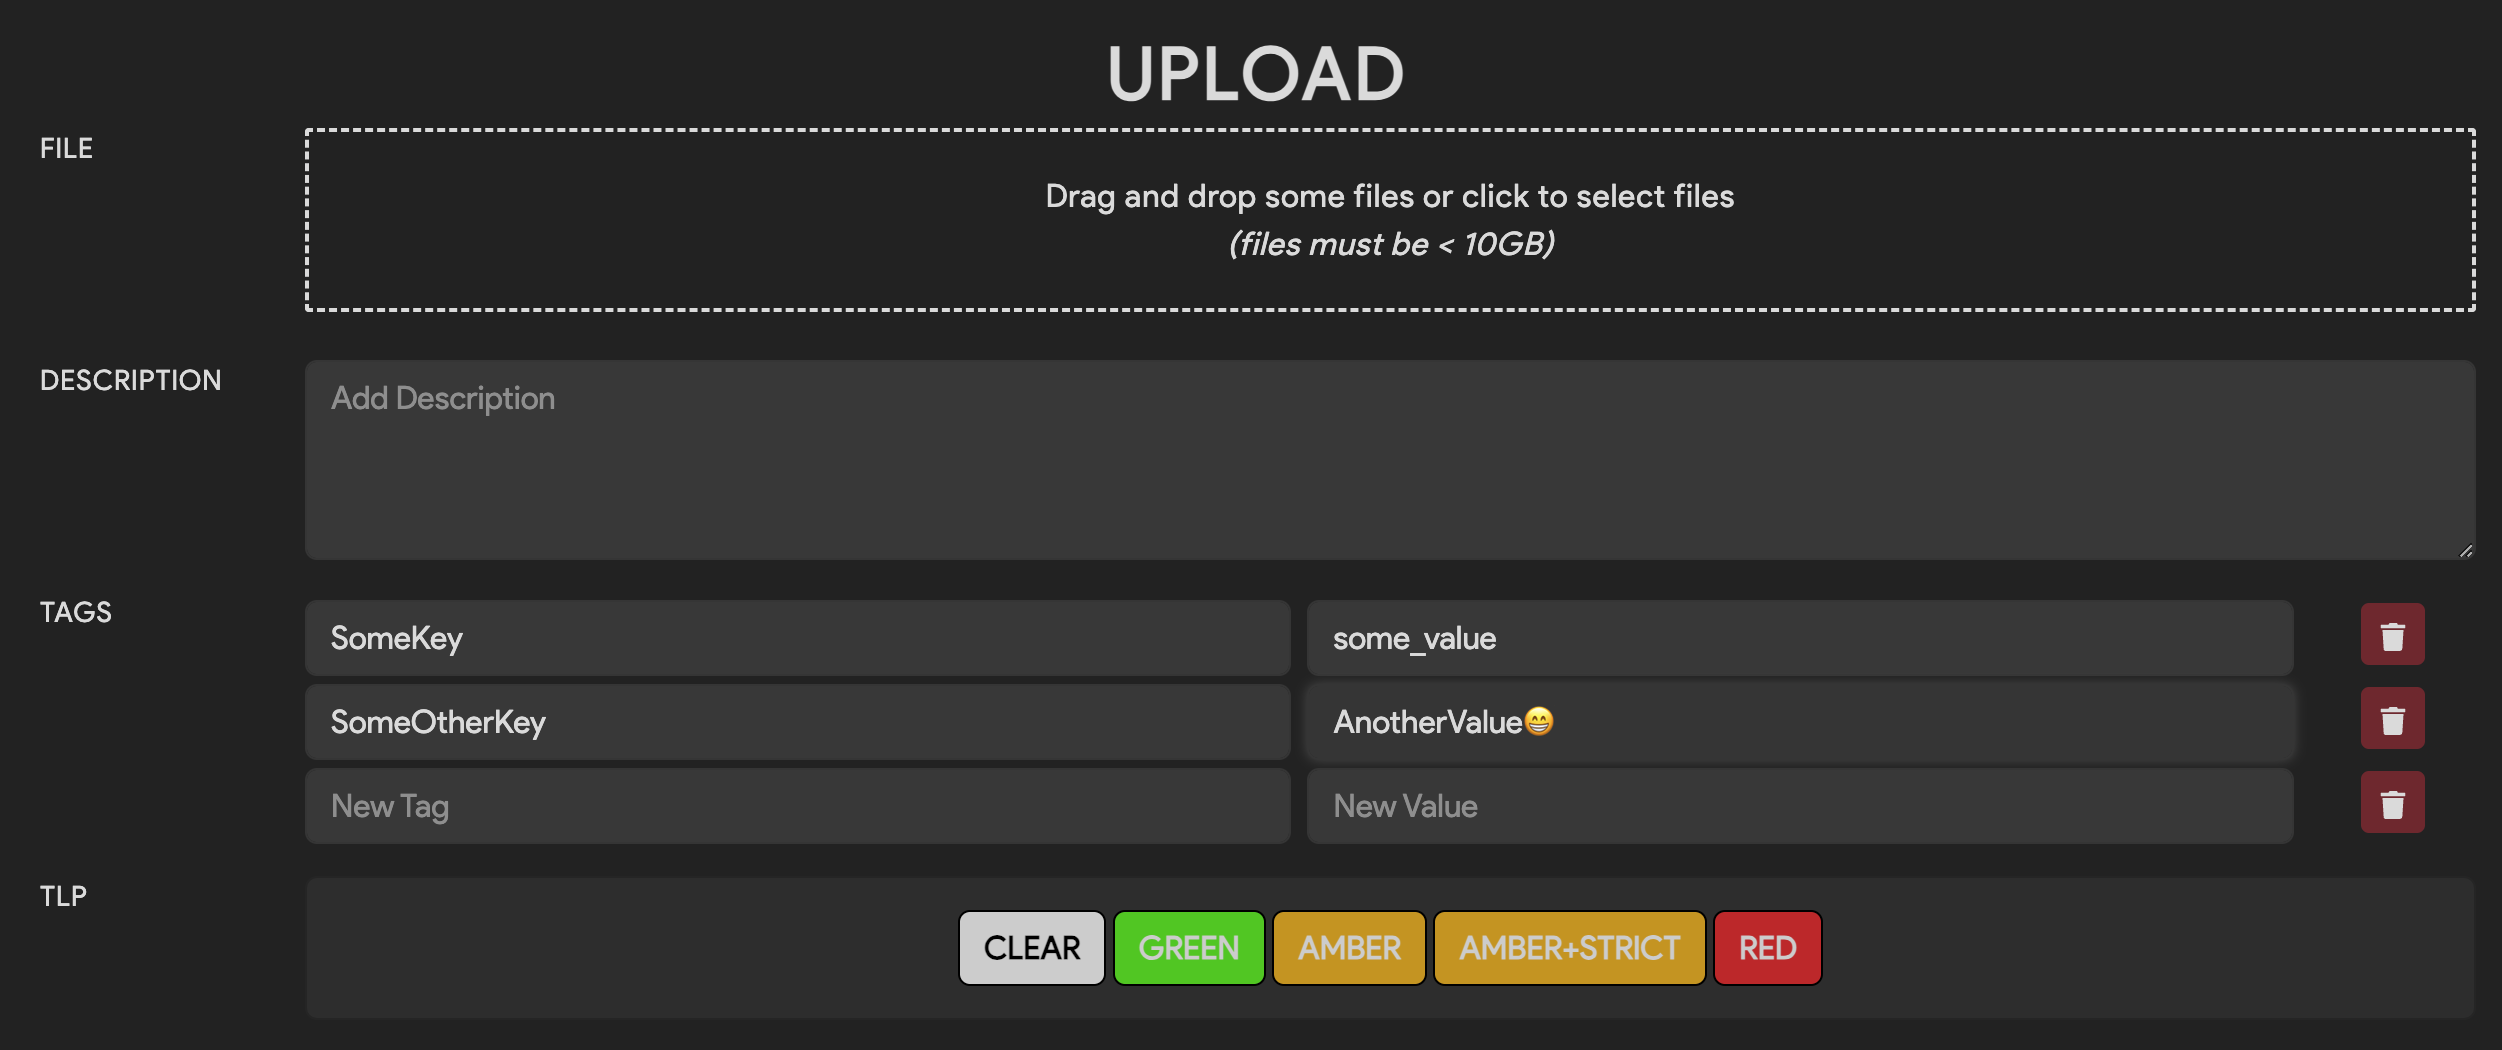
Tagging on Upload (Web UI)
You can specify tags when the file is uploaded via the Web UI. Once you have selected files to upload, enter in some key/value pairs in the tags section. Both a key and value are required to upload a given tag. Values for a tag cannot be blank/empty strings.
Tagging on Upload (Thorctl)
When using Thorctl to upload one or more file(s), you can apply key/value tag pairs with the -t key=value or
--tags key=value flag.
$ thorctl files upload --file-groups demo --tags TagKey=sometagvalue /path/to/upload
If you want to specify multiple tags to apply to each file you upload, supply the -t or --tags flag multiple
times:
$ thorctl files upload --file-groups demo --tags Key1=value1 --tags Key2=value2 /path/to/upload
Editing Tags (Web UI)
Tags can be added or removed after a sample has been uploaded via the Web UI.
Using the Web UI, navigate to the file details page and click the edit button right under the tags icon. Once you have clicked edit, you can add new tags or remove existing tags. When you are satisfied with your changes press the green save tag changes button and confirm you wish to commit those changes.
Editing Tags (Thorctl)
When using Thorctl to tag an existing file, use the tags command.
$ thorctl tags add --add-tags platform=MacOS --files 619dddbd681b593d8c6f66de50dd41e422bfac7a83feab6c3f0944de7c73a4d3
To add multiple tags at once, repeat the --add-tags option.
$ thorctl tags add --add-tags platform=MacOS --add-tags OS_Version=13.7.4 --files 619dddbd681b593d8c6f66de50dd41e422bfac7a83feab6c3f0944de7c73a4d3
To delete a tag, you must specify the complete name=value tag to remove.
$ thorctl tags delete --delete-tags "stripped=false" --files 619dddbd681b593d8c6f66de50dd41e422bfac7a83feab6c3f0944de7c73a4d3
Be aware that thorctl will report success for deleting a non-existent tag.
Spawning Reactions
In Thorium terminology, a reaction is a unit of work where one or more tools run on some data within a pipeline.
Thorium allows for many tools, called images, to be strung together into sequential or parallel stages of
a pipeline. The process for configuring images to run within Thorium and building pipelines is covered in detail
within the Developer chapters.
WebUI
The Web UI currently only allows users to spawn reactions for a single file at a time. If you wish to spawn reactions on many files, follow the Thorctl examples below. Once you have spawned a reaction, you can follow its progress and even view the stdout/stderr in the logs for that reaction stage. This allows you to easily troubleshoot tools if your analysis jobs fail to complete successfully.
Thorctl
Thorctl allows you to spawn reactions for a single file or many files at once. Use the following command to spawn a single reaction on a specific file using the file’s SHA256 hash:
thorctl reactions create --group <PIPELINE_GROUP> --pipeline <PIPELINE> <SHA256>
If you want to run a pipeline on files that have a specific tag or tags, add the -t/--tags flag and specify a tag in the format
KEY=VALUE as shown below:
thorctl reactions create --limit <LIMIT> --group <PIPELINE_GROUP> --pipeline <PIPELINE> --tags Datatset=Examples
To specify multiple tags, enter a -t/--tags flag for each tag:
thorctl reactions create --limit <LIMIT> --group <PIPELINE_GROUP> --pipeline <PIPELINE> --tags Tag1=Hello --tags Tag2=Goodbye
You can also watch the status of reactions using --watch or -W.
$ thorctl reactions create --group demo --pipeline test-pipeline --watch
CODE | PIPELINE                  | SAMPLES                                                          | ID                                   | MESSAGE
-----+---------------------------+------------------------------------------------------------------+--------------------------------------+----------------------------------
200  | test-pipeline              | 85622c435c5d605bc0a226fa05f94db7e030403bbad56e6b6933c6b0eda06ab5 | a0498ac4-42db-4fe0-884a-e28876ec3496 | -
-----+---------------------------+------------------------------------------------------------------+--------------------------------------+----------------------------------

	WATCHING REACTIONS

STATUS       | PIPELINE                  | ID
-------------+---------------------------+--------------------------------------
...
Thorctl Run
You can also quickly create a reaction, monitor its progress, and save its results to disk using the thorctl run command:
thorctl run <PIPELINE> <SHA256>
Unlike thorctl reactions create, thorctl run will display the stdout/stderr output of each stage in real time and
automatically save the results to disk, effectively emulating running the reaction locally on your machine. This might be
preferable to thorctl reactions create for running a quick, one-off reaction.
Reaction Status
The status of a reaction can be used for monitoring the progress of the analysis jobs you create. You can view the
status of reactions on the file details page through the Web UI or using the -W flag when submitting reactions using
Thorctl.
After a reaction has been submitted, its initial status is Created. Reactions that have been scheduled by the Thorium
Scaler and executed by an Agent process will enter the Running state. These reactions will run until either the
tool completes successfully, returns an error code, or is terminated by Thorium for exceeding its runtime specification
(resources limits or max runtime). All failure states will cause the reaction to enter the Failed state. Successful
runs of all images within the pipeline will cause the reaction to be marked as Completed.
| Status | Definition |
|---|---|
| Created | The reaction has been created but is not yet running. |
| Running | At least one stage of the reaction has started. |
| Completed | This reaction has completed successfully. |
| Failed | The reaction has failed due to an error. |
Reaction Lifetimes
Once a reaction has reached its terminal state (Completed or Failed), the reaction status and logs will see no
future updates. Thorium applies a lifespan of 2 weeks for reactions that have reached a terminal state. After this
lifespan has been reached, Thorium will cleanup info about the expired reaction. This cleanup does not delete tool
results and only affects reaction metadata such as the reaction’s status and logs. This helps to prevent infinite
growth of Thorium’s high consistency in-memory database, Redis. Because of this cleanup, users may not see any
Reactions listed in the Reaction Status section of the Web UI file details page even when tool results are visible.
Search
Thorium also allows users to search through tool results and file tags to find interesting files. This is currently only available in the Web UI and can be accessed on the home page. Thorium uses the Lucene syntax for search queries.
It’s important to note that documents are indexed per group. This means that for a document to be returned, all search parametes must be met by at least one group (see the below FAQ for more details).
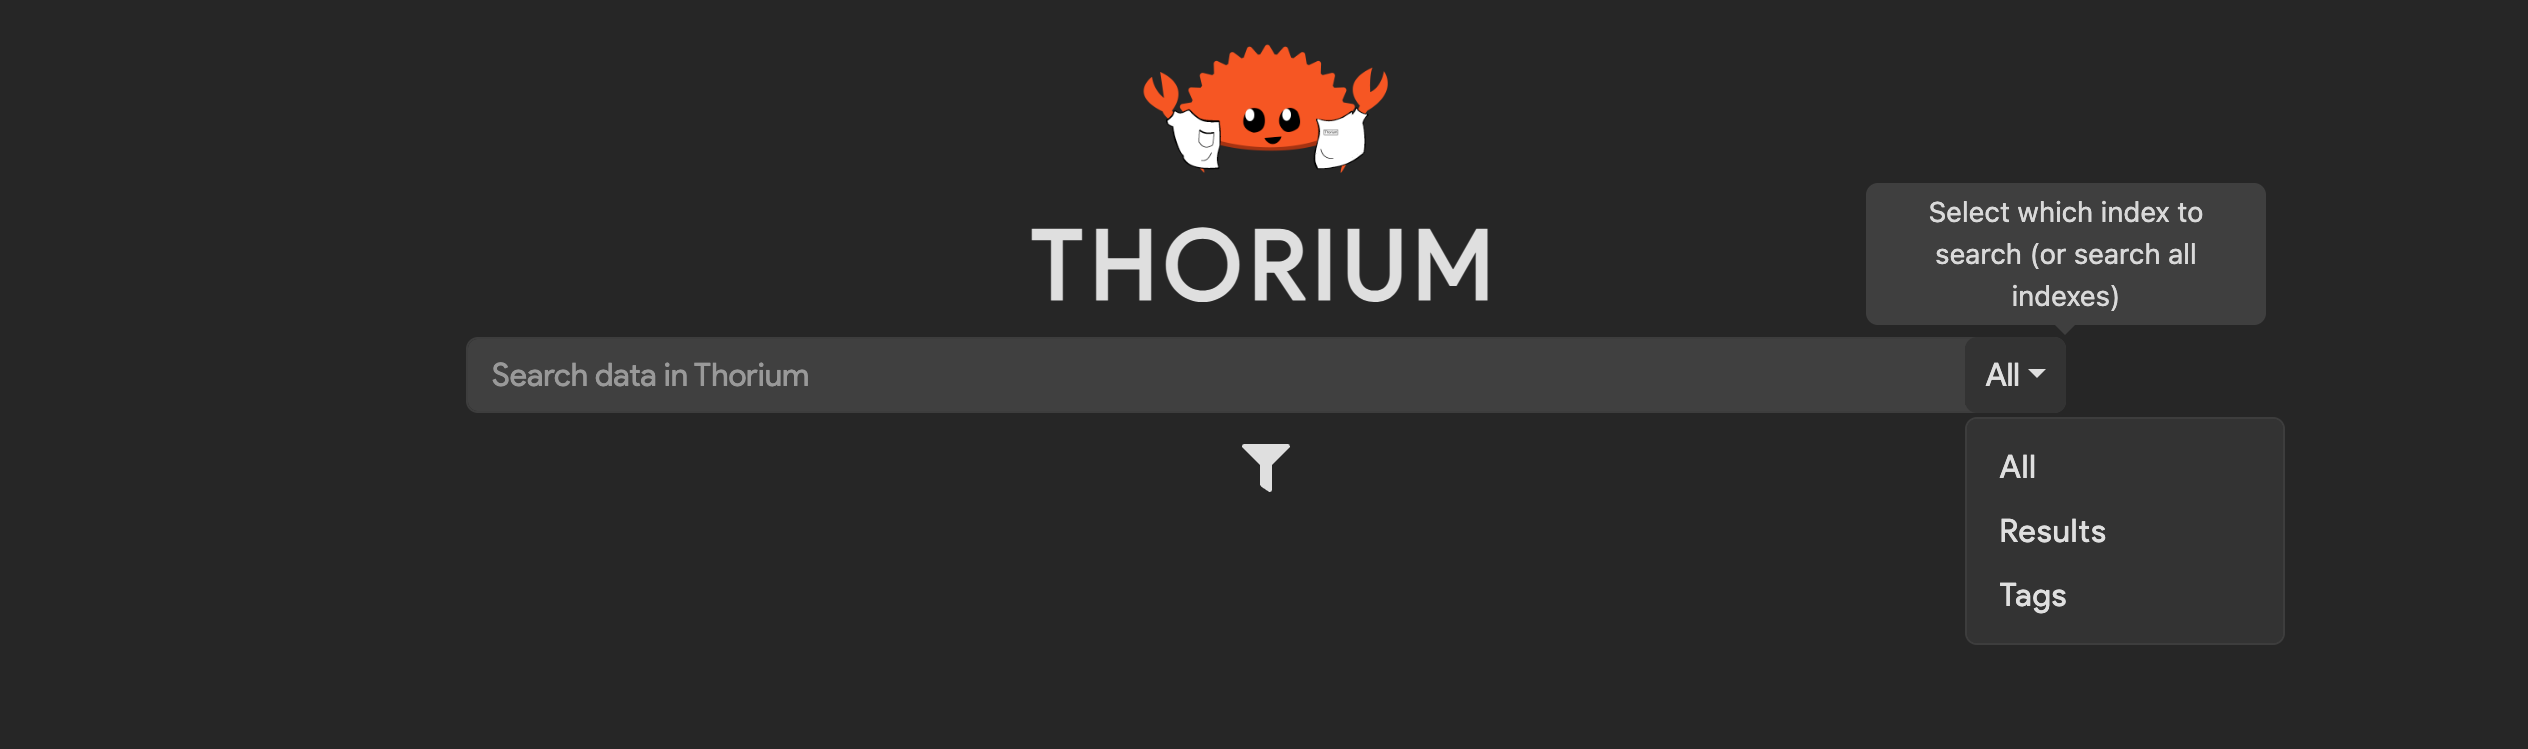
Indexes
Data is stored in Elasticsearch in various indexes based on the data type (i.e. results are stored separately from tags). You can select the index to search on by selecting the dropdown on the right of the search bar. Searches are performed on all indexes by default.
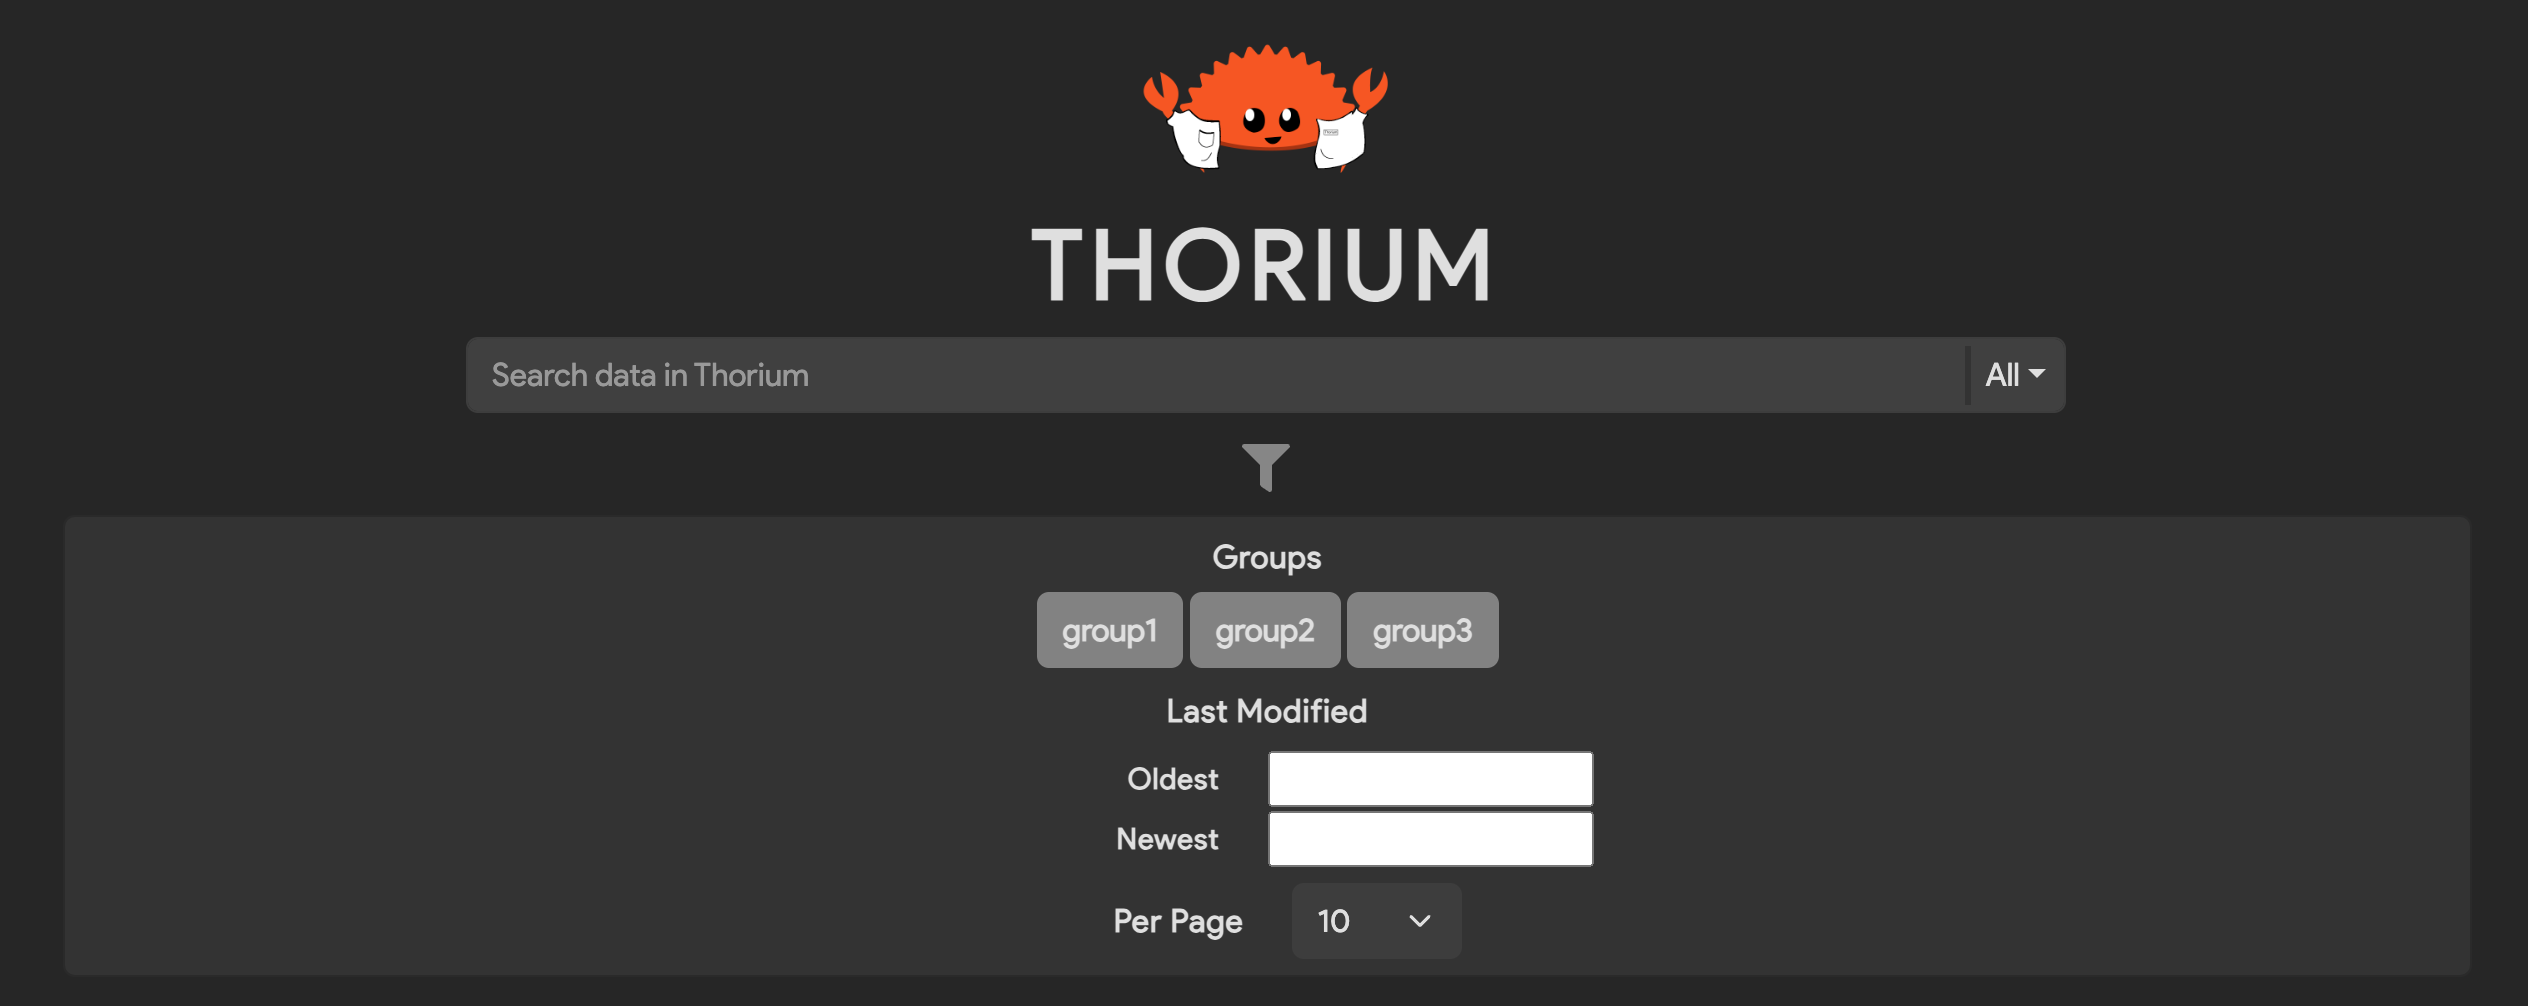
Search Parameters
You can specify various parameters for your search by clicking the funnel icon below the search bar. Parameters include the sample’s group(s), the date the sample was last modified, and the number of search results to display per page. By default, no groups are selected and searches are performed on all of the user’s groups.
Examples
The following are examples of possibl search queries using Lucene syntax.
Querying for tags/results containing the text pe32:
pe32
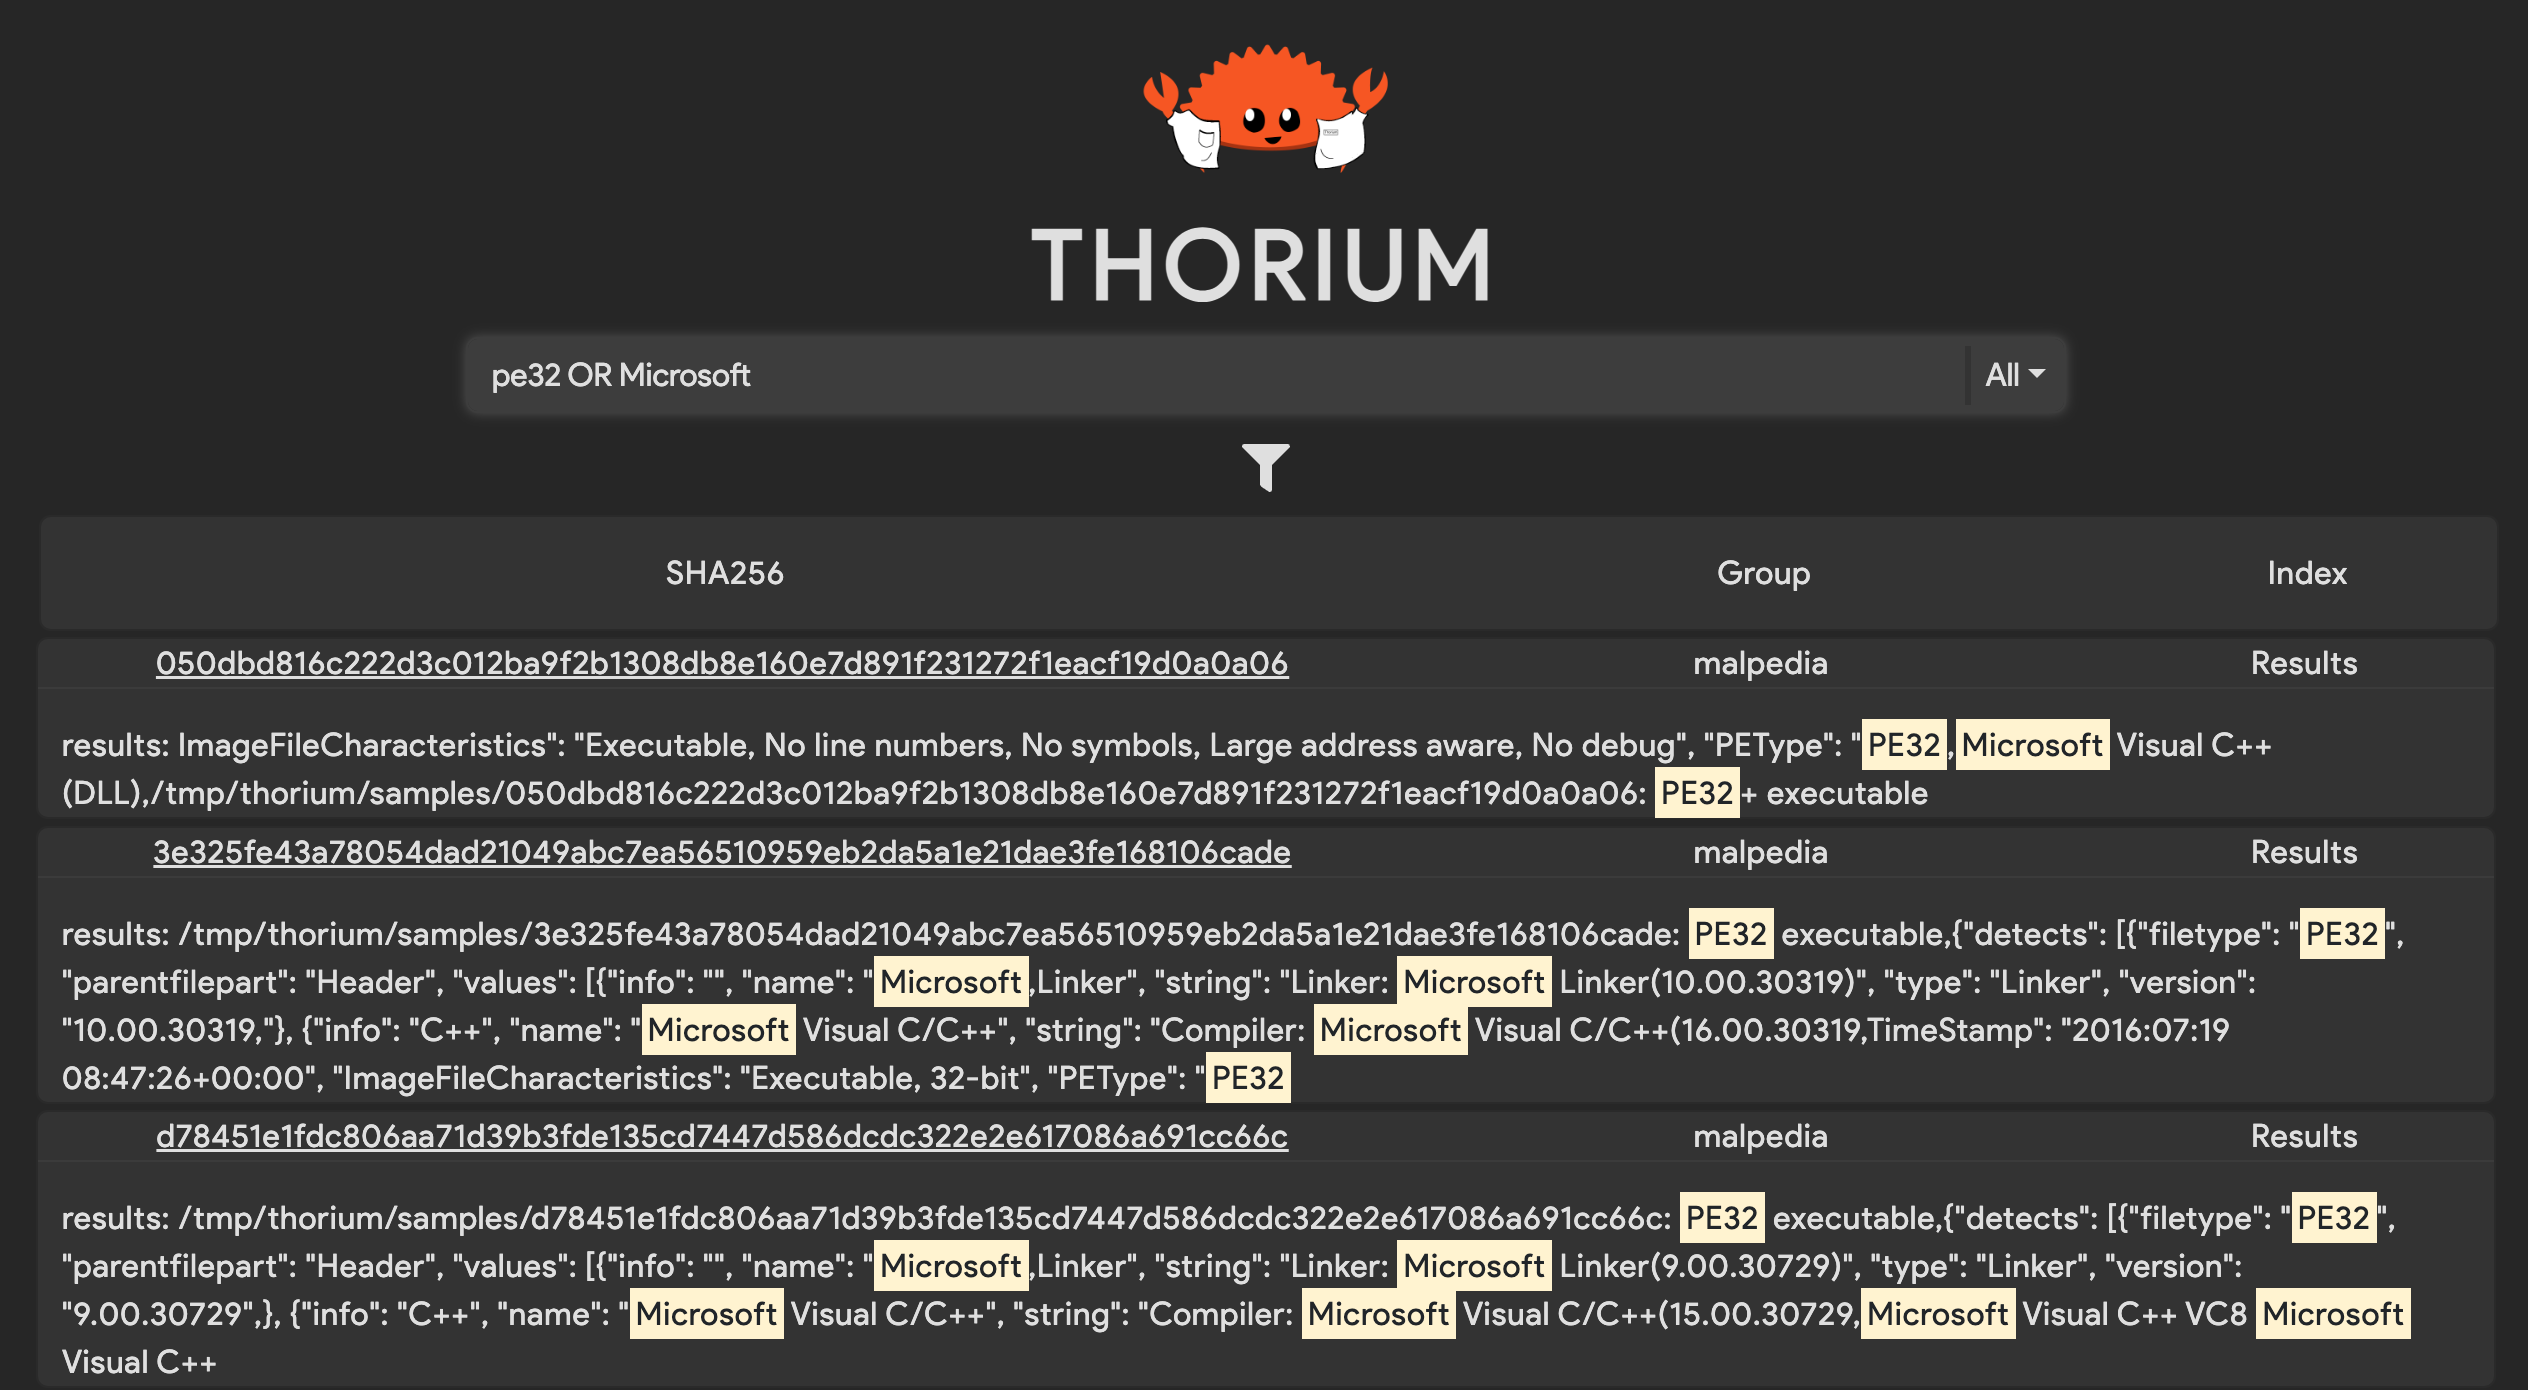
Querying for tags/results containing pe32 or Microsoft:
pe32 OR Microsoft
Querying for tags/results containing rust and x86_64:
rust AND x86_64
Querying for tags/results containing the string rust and x86_64. Use quotes to
wrap search queries that contain white space or conditional keywords:
"rust and x86_64"
Querying for tags/results containing the string rust and x86_64 and pe32:
"rust and x86_64" AND pe32
Querying for tags/results containing pe32 or string rust and x86_64 and pe32:
pe32 OR ("rust and x86_64" AND pe32)
All UTF-8 text is supported:
✨Some 🤪 UTF-8 😁 text!!!✨
Results
Querying for results where a field named PEType is set to "PE32+"
"PEType:\"PE32+\""
Tags
Note: Tags are stored in Elasticsearch with
=delimiting the key and value. That means that the most effective way for searching for whole tags is by using=. Using other delimiters (e.g.:) may cause otherwise matching tags to not appear.
Querying for the tag arch=x86_64:
arch=x86_64
Querying for tags exactly matching arch=x86_64 (use quotes):
"arch=x86_64"
Querying for files with either the tag arch=x86_64 or arch=arm64:
arch=x86_64 OR arch=x86_64
Querying for files with both tags Lang=Rust and arch=x86_64:
Lang=Rust AND arch=x86_64
If tags contain Lucene keywords (e.g. AND, OR, etc.), use quotes:
"Tag With Spaces=Keywords AND OR" AND "Tag=Value"
FAQ
Why does it take some time for data to become searchable?
It can take some time (usually < 10 seconds) for results to be searchable in
Thorium because they are indexed asynchronusly by a separate component called
the Thorium search-streamer. The time it takes for the search-streamer
to index data depends on how much data has been added/modified/deleted in
Thorium recently.
What do groups have to do with searching in Thorium?
Due to Thorium’s permissioning requirements and how Elastic operates, a file will have a separate document in Elastic for each group containing results/tags visible in that group. That means that for a file to appear in the search results, all of the given search parameters must for at least one group.
For example, let’s say we have one sample with a placeholder SHA256 of my-sha256. This
sample is in two groups, GroupA and GroupB. The file has tags in both groups, but
not all of them are shared between groups. Our data would look something like this:
[
    {
        "sha256": "my-sha256",
        "group": "GroupA",
        "tags": [
            "Corn": "IsGood",
            "HasTaste": "true",
            "Fliffy": "IsAGoodDog"
        ]
    },
    {
        "sha256": "my-sha256",
        "group": "GroupB",
        "tags": [
            "Corn": "IsBad",
            "HasTaste": "false",
            "Fliffy": "IsAGoodDog"
        ]
    }
]
So the following query would return the sample from both groups because both of the groups have the given tag:
Query: "Fliffy=IsAGoodDog"

Results:

"my-sha256", "GroupA"
"my-sha256", "GroupB"
But this query would return no samples because neither of the groups have both of the given tags:
Query: "Corn=IsBad AND HasTast=true"

Results:
Viewing Results
Tool results are created when a pipeline is run on a target file. The running pipeline instance is called a
reaction and may involve running several tools (called images) on the target file. The analysis artifacts created
by each tool are then automatically stored in Thorium after each pipeline stage has completed. We organize tool
results based on the name of the tool/image rather than the name of the pipeline where that tool was run.
Tools may generate several types of result output, including renderable and downloadable formats. These artifacts include:
- results: renderable data including basic text and JSON formatted tool output
- result-files: downloadable files produced by the tool and any tool results larger than 1MB
- children: unpacked or transformed files that Thorium treats like sample files due to potential maliciousness.
You can view or download results and child files from both the Web UI and Thorctl.
Web UI
Results and Result Files
You can navigate to the details page for a file using the sha256 hash of that file, or by browsing and searching
through Thorium’s data. If you are already on the file details page and see your reaction’s have completed, refresh the
page to get the latest tool results!
Once you load the file details page, click the Results tab that’s displayed after the submission info section. You
should see tool results that you can scroll through as shown in the video below.
You can also jump to results by clicking on the tools corresponding tag for a particular tool result.
Tools can create renderable results as well as result files. If a tool produces a result files, those files can be downloaded using the links at the bottom of the result section for that tool.
The number of result files that a tool produced will be displayed on the header of the results section. That file count badge can be clicked to jump to the result files links.
Children Files
Many tools will produce entirely new samples called children files that are saved in Thorium after the tool exits.
For example, an unpacking tool might remove protective/obfuscating layers of a given malware sample in order to unpack
the core payload and save it as a new sample in Thorium for further analysis. The sample that a tool was run on to
produce a child file its parent file. The origin information on a child file’s details page contains a convenient link
to the child’s parent. Clicking the link will take you to the sample details of the parent file.

Thorctl
You can download results for specific samples using Thorctl with the following command:
thorctl results get <SHA256>
Download results for multiple samples by passing multable file SHA’s:
thorctl results get <SHA256-1> <SHA256-2> <SHA256-3>
If you want to download results for specific tools then you can use the following command:
thorctl results get --tools <TOOL> --tools <TOOL> <SHA256>
You can also get results for any samples with a certain tag with the following command:
thorctl results get --tags Dataset=Examples
The tool and tag flags can be set together to get the results of running a tool on samples with a particular characteristic:
thorctl results get --tools analyzer --tags Packed=True
The number of results from which Thorctl downloads files is limited to prevent inadvertent massive download requests.
To change the limit, use the --limit/-l flag:
thorctl results get --tags Incident=10001234 --limit 100
Downloading Files
If you need to download a file to carry out further manual analysis steps, you can do so via the Web UI or Thorctl. Because samples stored in Thorium are often malicious, they are downloaded from Thorium in a non-executable state, either in a safe CaRTed format or as encrypted ZIP files. This means that before a downloaded file can be analyzed, it must be either be unCaRTed or decrypted/extracted from the ZIP archive to return it to its original, potentially executable, state. If you are working with malicious or potentially malicious files, only unCaRT them in a safe location such as a firewalled virtual machine. Keep in mind that most anti-virus applications will immediately detect and quarantine known malware after extraction, so disabling anti-virus applications entirely may be necessary to effectively extract the sample. Be careful when dealing with extracted malware samples!
Cart vs Encrypted Zip
Thorium supports two different download types each with its own pros and cons:
| Capability | CaRT | Encrypted Zip |
|---|---|---|
| Encrypted | ✅ | ✅ |
| Compressed | ✅ | ✅ |
| Streaming Extraction | ✅ | ❌ |
| API Load | low | high |
| Native Windows/Linux/Mac Support | ❌ | ✅ |
At a high level encrypted zips are more user friendly but are less performant and cause a high load on the API. When peforming actions at scale or working with large files using CaRT is highly recommended.
Web UI Sample File Download
You can choose between CaRTed and encrypted ZIP format when downloading files using the Thorium Web UI. If the file is in the CaRTed format You will need to use a tool such as Thorctl to unCaRT the file after it has been downloaded and moved into a sandboxed environment.
Thorctl File Download
Alternatively, you may use Thorctl to download the file on the command line in either a CaRTed or unCaRTed format. You can download a single file by its sha256 hash using the following Thorctl command:
thorctl files download <sha256>
Thorctl’s current behavior is to download the file in a CaRTed format by default. Downloading files as encrypted ZIP’s is not
currently supported in Thorctl. If you want to immediately unCaRT the file, you can use the -u or --uncarted flag.
thorctl files download --uncarted <sha256>
If you want to download the file to a different path, that is not in the current working directory, you can use the
-o/--output flag.
thorctl files download --output /path/to/download/directory <sha256>
You can also download multiple files by specifying a metadata tag that the downloaded files must have and the -l/--limit flag
to specify how many files you would like to download.
thorctl files download --carted --limit 100 --tags Incident=10001234
If you do not specify a limit count when you provide a key/value tag, Thorctl will default to downloading a maximum of 10 files.
CaRTing/UnCaRTing Files
Thorctl also has the ability to CaRT and unCaRT local files. This is particularly helpful if you want to download a file in a CaRTed format and then unCaRT it in a quarantined location later or CaRT files to store after analysis is complete.
CaRTing Files
To CaRT a file, simply run:
thorctl cart <path-to-file>
You can also CaRT multiple files in one command:
thorctl cart <path-to-file1> <path-to-file2> <path-to-file3>
Specifying an Output Directory
CaRTing with Thorctl will create a directory called “carted” in your current directory containing the CaRTed files
with the .cart extension. To specify an output directory to save the CaRTed files to, use the -o or --output flag:
thorctl cart --output ./files/my-carted-files <path-to-file>
CaRTing In-Place
You can also CaRT the files in-place, replacing the original files with the new CaRTed files, by using the
--in-place flag:
thorctl cart --in-place <path-to-file>
CaRTing Directories
Giving the path of a directory to CaRT will recursively CaRT every file within the directory.
thorctl cart <path-to-dir>
Because CaRTed files will be saved together in one output folder, collisions can occur if files have the same name
within a directory structure. For example, let’s say I have a directory called my-dir with the following structure:
my-dir
├── dir1
│   └── malware.exe
└── dir2
    └── malware.exe
Because Thorctl will recursively CaRT all files within my-dir and save them in one output directory, one
malware.exe.cart will overwrite the other. To avoid such collisions, you can either use the aforementioned
--in-place flag to CaRT the files in-place or use the -D or --preserve-dir-structure flag to output files in a
structure identical to the input directory. So CaRTing my-dir with the above structure using the
--preserve-dir-structure option would yield the output directory carted, having the following structure:
carted
└── my-dir
    ├── dir1
    │   └── malware.exe.cart
    └── dir2
        └── malware.exe.cart
Filtering Which Files to CaRT
There may be cases where you want to CaRT only certain files within a folder. Thorctl provides the ability to either
inclusively or exclusively filter with regular expressions using the --filter and --skip flags, respectively.
For example, to CaRT only files with the .exe extension within a directory, you could run the following command:
thorctl files cart --filter .*\.exe ./my-dir
Or to CaRT everything within a directory except for files starting with temp-, you could run this command:
thorctl files cart --skip temp-.* ./my-dir
Supply multiple filters by specifying filter flags multiple times:
thorctl files cart --filter .*\.exe --filter .*evil.* --skip temp-.* ./my-dir
The filter and skip regular expressions must adhere to the format used by the Rust regex crate. Fortunately, this format is very similar to most other popular regex types and should be relatively familiar. A helpful site to build and test your regular expressions can be found here: https://rustexp.lpil.uk
UnCaRTing Files
UnCaRTing in Thorctl looks very similar to CaRTing as explained above but uses the uncart command instead:
thorctl uncart <path-to-CaRT-file>
You can specify multiple CaRT files, unCaRT in-place, preserve the input directory structure, and apply filename
filters just as with the cart command. For example:
thorctl uncart --filter .*\.cart --skip temp-.* --output ./my-output --preserve-dir-structure ./my-carts hello.cart
Commenting on Files
Commenting on files is a great way to share your progress and insights from analyzing a file. Anyone that is a member of at least one of your groups that has access to the file will be able to view your comment. You can leave a comment on a file through the Web UI by following the steps shown in the video below.
Comment Attachments
You can also upload files as attachments to your comments. Unlike files/samples, comment attachments are not stored in the safe CaRTed format. Only submit benign data as a comment attachment.
If you need to submit a manually modified version of
a sample, you can do so by uploading the modified sample with an Origin of Unpacked or Transformed and with the
Parent value set to the SHA256 of the original file.
Revoking Your Token
If for some reason you need to revoke your Thorium token, you can do so via the profile page in the Web UI. When you click the revoke button you will see a warning:
Revoking your token will automatically log you out of this page and any currently running or queued analysis jobs (reactions) may fail. Are you sure?Reactions run as your user and with your user’s Thorium token. As a result, revoking your token will cause any currently
Runningreactions to fail. This includes reactions in theRunningstate or reactions in theCreatedstate that start to run before the revocation process completes. You can always resubmit reactions that fail after you have revoked your token.If you are sure you want to revoke your token, click confirm. After the token has been revoked, you will be logged out of your user session and redirected to the login page.
Developers
Thorium developers have all the abilities of someone with the User system role, but have the added ability to create
and modify analysis tools (called “images”) and build pipelines from those tools. Just like a Thorium user, developers
can:
- upload files and Git repositories
- add and remove metadata tags on uploaded files and repositories
- run a pipeline on a file or repository (called a reaction)
- view reaction status and logs
- view tool results
- comment on files and upload comment attachments
- create new groups
Additionally, developers can:
- Create, modify, and delete images and pipelines.
A developer must have adequate group permissions (via their group role) to create, modify or delete an image/pipeline
within a group. They must be an Owner, Manager or User within the group to create resources in that group.
The Monitor role grants view-only permissions and does not allow the group member to create, modify or delete group
resources.
What Are Images?
In Thorium a tool is called an image. Images are a combination of a command line (CLI) tool and all the configuration information needed to run that tool in one of Thorium’s execution environments. Before you can add or modify an image, you must have the developer role. If you don’t yet have that role, you may request it from your local Thorium admins. Once you have the developer role, you can learn about the process for adding new images and how to correctly configure images.
Creating/Adding A New Image
To add a new image, you must tell Thorium how to run your tool via the image’s configuration settings. This runtime configuration may seem complicated, but has been designed to minimize or eliminate the need to customize your tool to work within Thorium. You tell Thorium how to run your tool and where your tool writes its outputs/results and Thorium can then handle executing your image within an analysis pipeline. Your tool does not need to know how to communicate with the Thorium API. Because of this functionality, any command line (CLI) tool that can run in a container or on bare metal can be added as a new image without any customization.
You may add a new image using the Web UI as shown in the following video. Adding images is not currently supported via Thorctl.
If you want to know more about the available image configuration options, you can go to the next section that explains how to configure an images. This section covers the required image configuration settings as well as the more advanced optional settings.
Configuring Images
This section explains each configurable image field. This information is critical to getting your image to run in Thorium. so please read each field description before attempting to add a new image. Images with incorrect configurations may fail when run or never be run at all.
Name
(Required)
Your image needs a name. Names must be unique within a group and can only consist of lower case alpha-numeric characters and dashes.
Group
(Required)
Assign your image to a group. An image may only be in a single group, although you can easily copy your image to different groups using the Web UI. Images are just a configuration so there is no waste in having duplicates.
Description
(Optional)
A basic text description of what this tool does and what analysis artifacts it may produce. It will be displayed in the image details, so please help users of your tool by providing a thorough description..
Scaler
(Required)
The Thorium scheduler that will be responsible for running this image. For containerized tools that execute static
analysis on files or repos, select K8s. If your tool must be run on bare metal hardware or does dynamic analysis,
please contact an admin for help with the setup of a BareMetal image.
| Scheduler | Description | Admin Setup Help Required |
|---|---|---|
| K8s | Scheduled by the Thorium Kubernetes scheduler, k8s scheduled tools are run in containers. | No |
| BareMetal | Scheduled by the Thorium BareMetal scheduler, BareMetal tools runs directly on a server outside of a container or VM. | Yes |
| External | Scheduling of external jobs is not handled by Thorium, external tools must interact with the API to get jobs and update job status. | No |
Image/Tag
(Required for K8s scheduled images)
For containerized tools that use the K8s scheduler, enter the image url:port/path:tag for the registry image. For
example, an image pulled from hub.docker.com would enter ubuntu:latest since its a default registry. A different
registry would use the registries URL and port to tell Thorium where to go to grab the container image.
registry.domain:5000/registry/path:v1.0
If the registry you specify requires authentication, you will need to provide a registry token for Thorium to pull your image before it will run. Please reach out to your local Thorium admins to provide that registry token.
Version
(Optional)
The version of the underlying tool that is executed when this image is run. Ideally the version you provide should formatted using semantic versioning, however this is not a requirement.
Timeout
(Required)
The maximum time an image will be allowed to run in seconds. A running image will be killed after this time limit has been reached.
Display Type
(Required)
If this tool produces any results, this configures what format are those results take. This setting is used by the Web UI to display any renderable tool results on the file/repo details page. For images that do not return results, select any value.
| Type | Description |
|---|---|
| Json | For a results file that is valid JSON, an interactive JSON renderer will be displayed. Url links to children files and downloadable result_files links will be displayed. |
| String | Plain text results get rendered along with links to children files and downloadable result_files links. |
| Image | Render any result_files images as well as any text output from the results file. Links to children files and downloadable result_files links are also displayed. Result_files must contain a valid image extension to be rendered in the Web UI. |
| Table | Display tool results as a two column table. Links to children files and downloadable result_files links are also displayed. |
| Disassembly | Display tool results as disassembled code from binary. The renderer will apply syntax highlighting if it recognizes the language of the file. |
| Hidden | Do not render results produced by this tool. Results will be hidden from users in the Web UI. |
| Custom | Custom renderers can be built for specific tools and added by Thorium’s Web UI developers. |
Spawn Limit
(Optional, defaults to Unlimited)
The max number of running images of this type that the Thorium scaler will attempt to spawn.
Collect Logs
(Optional, defaults true)
Boolean value on whether Thorium will collect stdout and stderr as logs from this image. Reaction logs can be viewed during and after a reaction runs and are useful for troubleshooting broken tools.
Generator
(Optional, defaults false)
Boolean value on whether this image will require Thorium to respawn it after it sleeps. This is useful for building long running tools that must checkpoint/sleep and then subsequently be respawned. This is an advanced feature that most tools/developers will ignore.
Resources
(Optional, defaults are set for CPU/Memory only)
The resources section tells Thorium what compute, memory, and storage resources your tool needs to successfully run. Values for CPUs, memory, ephemeral storage, and GPUs may all be set.
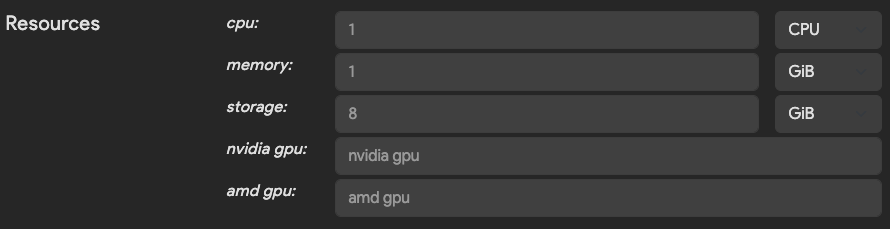
You should set these values to the largest expected value your tool will need to run. If your tool’s peak memory usage is 16GB, select at least that amount for the image’s memory resource configuration. If you set a value that is too low for memory or CPU usage, your tool may run slowly and/or be killed for using more resources than this configuration allows. On the other hand, selecting values that are too high for any resource may limit or prevent Thorium from scheduling your tool to run. Thorium can only schedule an image to run on systems where there are resources available to meet the requested resource values for that image.
Arguments
(Optional)
Arguments define how Thorium will trigger the execution of your tool. Command line arguments for a tool are built based on this configuration.
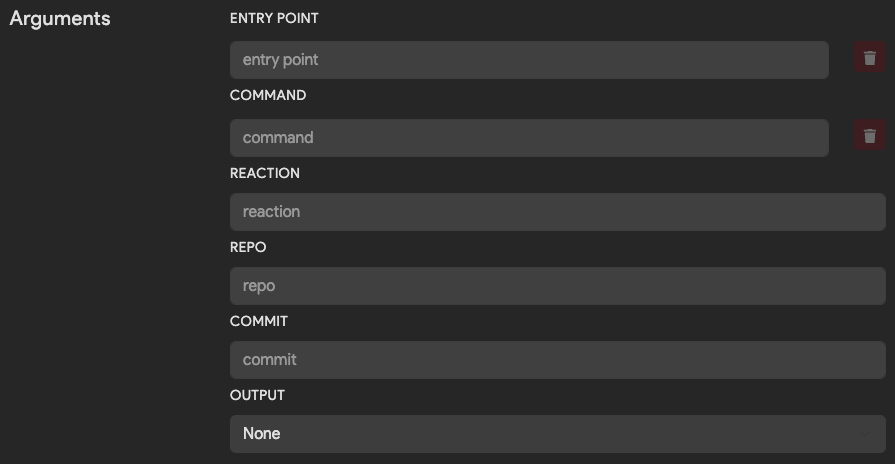
The following table explains what each optional argument does and when to specify it.
| Argument | Description | Example |
|---|---|---|
| Entrypoint | The initial executable to run. | /path/to/python3 |
| Command | List of parameters to pass to the Entrypoint executable, one value per form field. | /path/to/script.py, --flag, some_value |
| Reaction | Flag to pass in UUID of the running Thorium reaction. Only specify if the tool needs a unique identifier. | --reaction |
| Repo | Flag to pass in repo name if a repo is being analyzed. | --repo |
| Commit | Flag to pass in commit hash if a repo is being analyzed. | --commit |
| Output | How to tell the tool where to place tool results/outputs. | Append to place the output path at the end of the command line args or use Kwargs and specify a flag to pass in the path such as --output |
Output Collection
(Optional)
After a tool has run, the Thorium agent will collect tool results, children files, and metadata tags. The Thorium agent, will then upload these artifacts to the API so they are accessible within the Web UI or using Thorctl. The output collection settings tell the agent how to handle these artifacts.
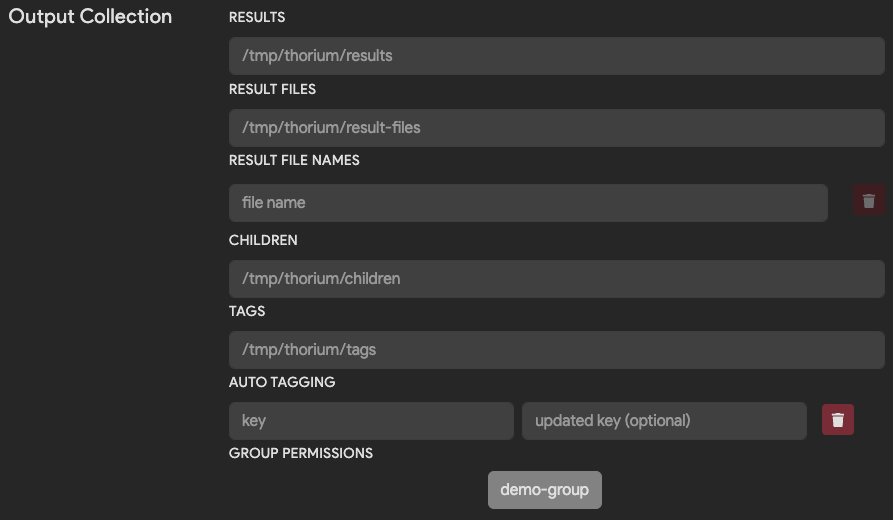
The following table explains how to configure the agent to handle your tools outputs.
| Field | Description | Default |
|---|---|---|
| Results | Path to a renderable result file. The contents of the file will be displayed in the Web UI based on the display_type setting. | /tmp/thorium/results |
| Result Files Path | Path to a directory of result files to upload. Result files will be displayed as downloadable links in the Web UI. | /tmp/thorium/result-files |
| Result File Names | Names of specific result files to upload. If specified all other files will be ignored. | None |
| Children | Path to a directory of children files produced by running the tool. Within this directory, children must be placed into a subdirectory with the type of child as its name: unpacked or source. Children files are automatically CaRTed upon upload to Thorium. | /tmp/thorium/children |
| Tags | Path to a JSON dictionary of key/value pairs to upload as tags. This file must be valid JSON. | /tmp/thorium/tags |
| Group Permissions | Groups to which results and tags are uploaded. By default tool results are upload to all your groups that have access to the target file/repo. Use this when you are working with potentially sensitive tools. | None |
When a tool’s analysis result is a valid JSON dictionary, the agent can automatically pull key/value tags and upload
them to the file or repo that the tool ran against. The following table explains how to configure Auto Tagging.
| Field | Description |
|---|---|
| Key | The matched key in the tools JSON result dictionary. The key must be at the root level of the dictionary. |
| New Key/Updated Key | The renamed string that will get uploaded as the new tag’s key. |
Child Filters
(Optional)
Child filters allow users to specify regular expressions to match on children files before submitting them. This is especially helpful working with a tool that outputs many files to its configured children directories with no easy way to filter them in the tool itself.
By default, children that match at least one filter will be submitted. If Submit Non-Matches is set, only
children that don’t match any of the given filters will be submitted. If no child filters are provided,
all children will always be submitted.
All filters must be valid regular expressions parseable by the Rust regex crate. If an invalid regular expression is provided, Thorium will return an error.
MIME Filters
MIME filters match on the MIME type of a file according to its magic number. Supported MIME types can be found
here.
For example, if you want to match only image MIME types, you can provide the filter image.*.
File Name Filters
File name filters match on children’s file names, including their extension. For example, if you want to submit
only children starting with lib, you can provide the filter lib.*.
File Extension Filters
File extension filters match on children’s file extensions without the leading . (exe, txt, so, etc.).
For example, if you want to submit only exe files, you can provide the filter exe.
Dependencies
(Optional)
Any samples, repos, tool results, or ephemeral files that your tool needs to run will be configured here. These configuration options help Thorium tell your tool where to find the tool’s dependencies that are automatically downloaded by the Agent before your tool is executed.
Samples
The Samples settings are relevant for tools used to analyze Thorium files. Since all files in Thorium are stored
in a CaRTed format, the agent handles the download and unCaRTing of those files before executing your tool. You may
use the sample dependency settings to change the default download path and how Thorium tells your tool where to find
the downloaded file(s).
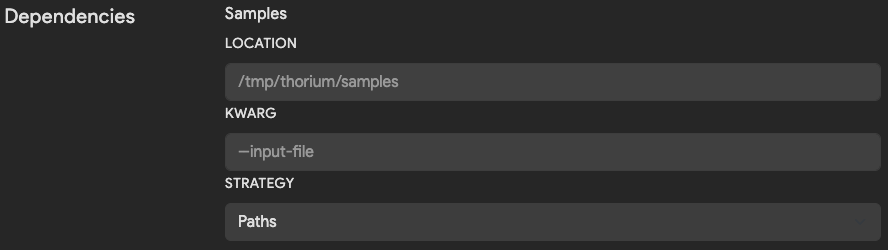
| Field | Description | Default |
|---|---|---|
| Location | Directory path to download files into. Downloaded files are named based on their sha256 hash. | /tmp/thorium/samples |
| Kwarg | Flag used to pass in name or path to file. If blank, positional args are used to pass in value. | None |
| Strategy | Whether to pass in path or name to the kwarg. Options are Path, Names or Disabled when no argument should be passed. | Path |
Repos
If a tool takes a Git repository as an input, this section can be configured to change the default location the Agent will download that repo into. Since all repos in Thorium are CaRTed upon upload, the agent will download and automatically unCaRT downloaded repos.
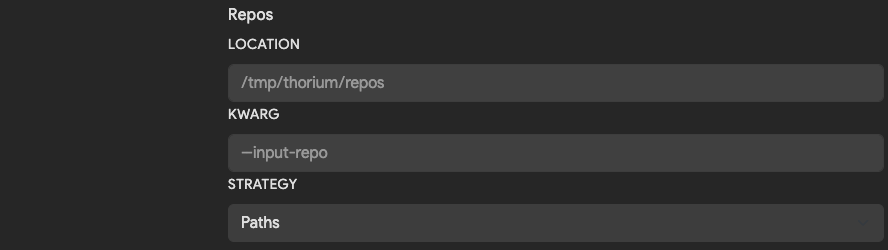
| Field | Description | Default |
|---|---|---|
| Location | Directory path to download repos into. | /tmp/thorium/repos |
| Kwarg | Flag used to pass in name or path to a repo. If blank, positional args are used to pass in value. | None |
| Strategy | Whether to pass in path or name to the kwarg. Options are Path, Names or Disabled when no argument should be passed. | Path |
Ephemeral and Results
Sometimes tools may take the outputs from another tool as their input. These tools will be configured to run in a multistage pipeline after being added. The below fields tell Thorium what inputs a tool requires and where to download those inputs into before running the tool runs.
What are ephemeral files?
Ephemeral files are discarded at the end of a pipeline run. You might call these files intermediate artifacts of the pipeline. They can be passed between the images that run within a pipeline using the following configurations.
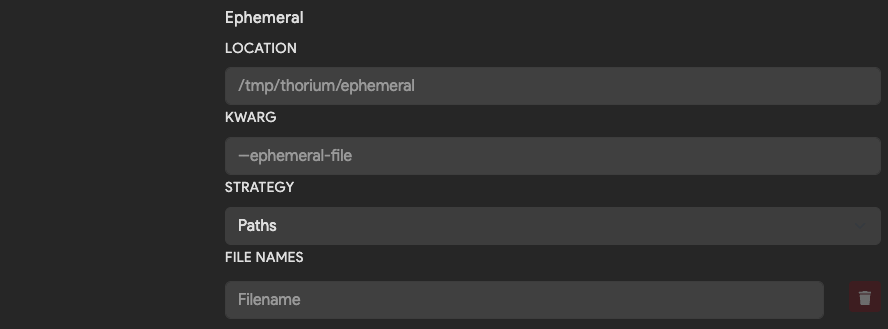
| Field | Description | Default |
|---|---|---|
| Location | Directory path to download ephemeral files into. | /tmp/thorium/ephemeral |
| Kwarg | Flag used to pass in name or path of each ephemeral file. If blank, positional args are used to pass in value. | None |
| Strategy | Whether to pass in path or name to the kwarg. Options are Path, Names or Disabled when no argument should be passed. | Path |
What are results?
Results are files that will be saved in Thorium after a tool runs. Unlike ephemeral files, the lifetime of a result is longer than the pipeline that generated it. You can view and download results in the Web UI or Thorctl any time after a tool runs.
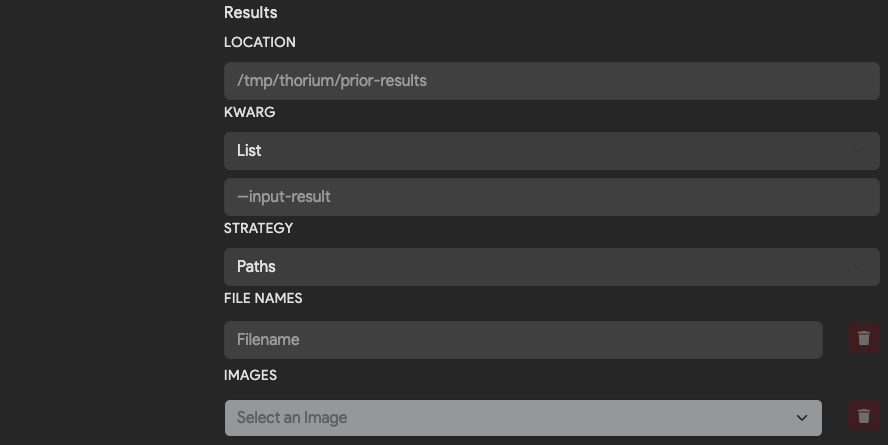
| Field | Description | Default |
|---|---|---|
| Location | Directory path to download input results into. | /tmp/thorium/prior-results |
| Kwarg | Flag used to pass in name or path of each input result file. | None |
| Strategy | Whether to pass in path or name to the kwarg. Options are Path, Names or Disabled when no argument should be passed. | Path |
| File Names | Names of result files to download from the dependent tool results. | Empty |
| Images | Names of other tools that this image need results from to run. | Empty |
What are tag dependencies?
“Tags” in the context of dependencies refer to the Thorium tags of the sample or repo dependencies for a given reaction
(described above in Samples and Repos). This is useful when you have an image that can make decisions
based on tags set by other images in Thorium (or even by previous runs of the same image). For example, if you have an image
that is more effective at analyzing a sample if it knows the original language it was compiled from, you could add another image
earlier in the pipeline that attempts to tag the image with its language of origin (e.g. Language=Rust). Then, after enabling
tag dependencies for the analysis image, you can refer to the sample’s tags in your image to see which language was inferred
and analyze accordingly.
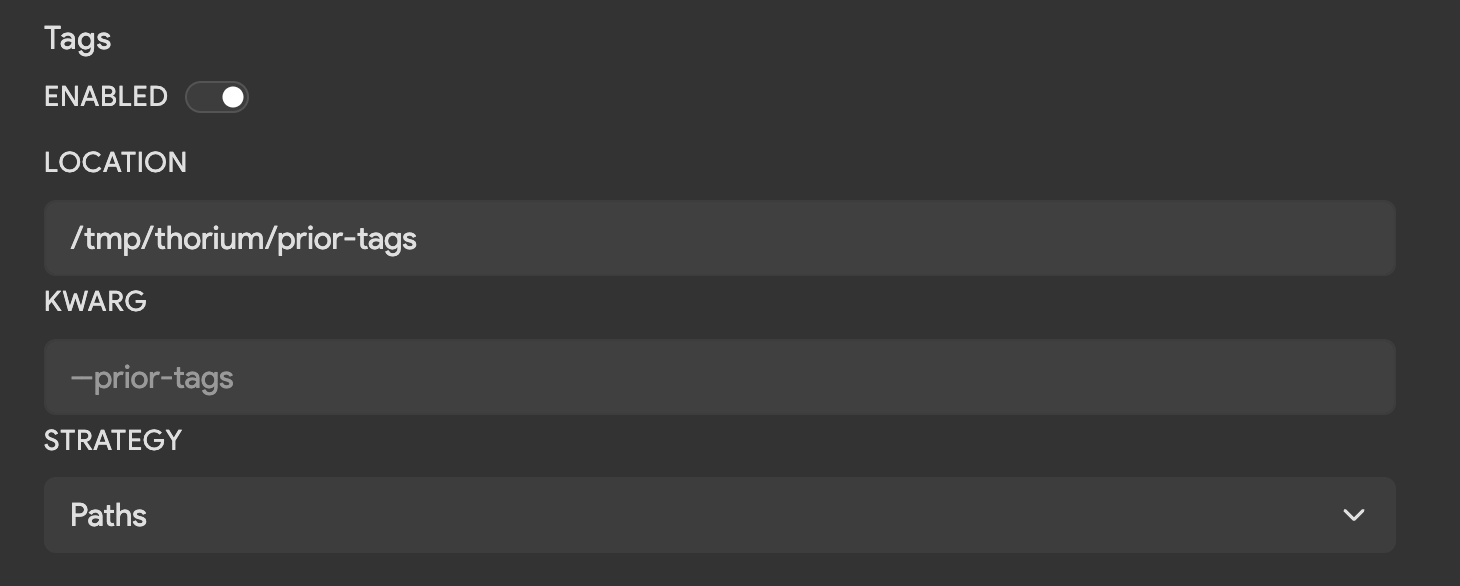
| Field | Description | Default |
|---|---|---|
| Location | Directory path to download sample/repo tags into. | /tmp/thorium/prior-tags |
| Kwarg | Flag used to pass in the name or path of each tags file. | None |
| Strategy | Whether to pass in the path or name to the kwarg. Options are Path, Names, Directory, or Disabled when no argument should be passed. | Path |
Tag files are by default saved to the directory /tmp/thorium/prior-tags and saved in the JSON format named as <SHA256>.json
for samples or organized into subdirectories by URL for repos (e.g. /github.com/project/repo.json). The following is an example of a
tag file:
{
    "Language": [
        "Rust",
    ],
    "Strings": [
        "Hello, world!",
        "Goodbye",
        "I'm a string 😎"
    ]
}
Environment Variables
(Optional)
Environment variables are dynamically set values that can affect the execution of a tool. Both Linux and Windows environments can have environment variables. Thorium will set any configured key/value environment variable pairs in the correct execution environment before an image runs. If your tool reads variables from the environment, it will be able to grab the key/value pair. A unique key is required when adding an environment variable. However, the value of that key can be empty/blank.

You can view the value of an environment variable on a Linux system using the following command:
echo $VARIABLE_NAME
VARIABLE_VALUE
This command may be useful when troubleshooting to confirm the environment variable is being set to the correct value when your tool runs.
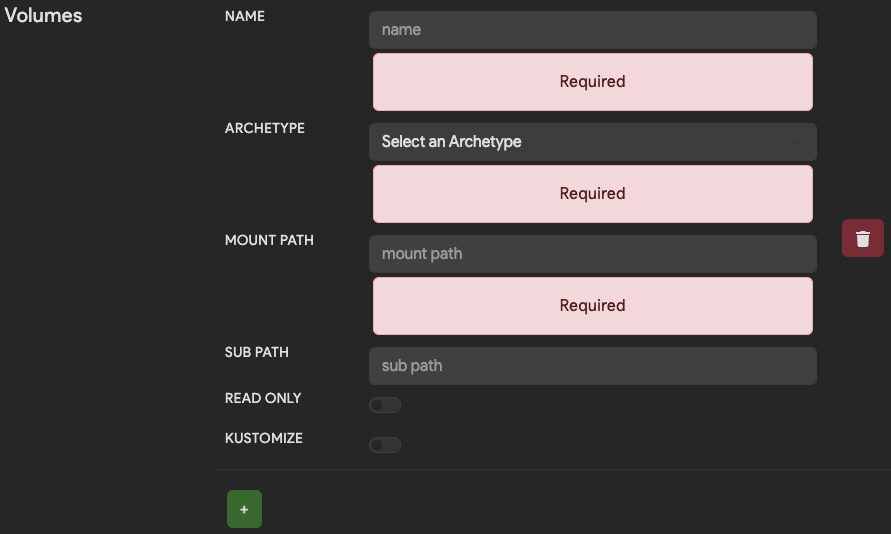
Volumes
(Optional, K8s images only)
Volumes are an advanced feature and are only relevant for tools that run in Kubernetes. Volumes in K8s can take the form of configuration files, secret files, host paths, or NFS shares. You can read more about K8s volumes in the K8s docs. If you think you need to map a volume into your K8s image you will need to reach out to an admin to have that volume setup within Thorium’s K8s instance.
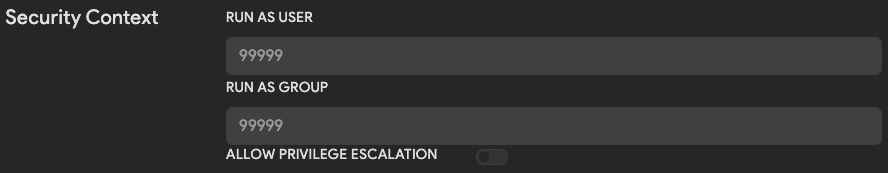
Security Context
(Optional, only admins can set these values)
By default Thorium runs all images as the user that requested them to run. This means that running tools have the effective user and group ID of a user rather than the developer that created the tool or some other privileged account. This helps to bound the abilities of tools that run in Thorium’s different execution environments. The security context values can be changed by admins to hard coded values that differ from these defaults. Note that the privilege escalation boolean setting is only relevant for images that run in K8s.
More on Children (Samples)
A sample submitted to Thorium as a result of running a Thorium reaction on another sample (the so-called “parent”) is called a “child.”
Origin Metadata for Children
Like any sample, children can have Origins to help identify where it came from later. Because children are submitted by the Thorium Agent automatically once a tool completes, it’s the tool’s responsibility to encode origin information by placing children in the origins’ respective directories (see the table in Output Collection) for the Agent to collect from.
In most cases, the Agent can infer origin metadata just from the placement of children by origin directory as well as from context
on how the Agent was run (e.g. which tool is running on which sample/repo). For example, the Agent can submit children with the Source
origin by collecting them from the source children directory (/tmp/thorium/children/source/ by default) and can infer metadata for
the Source origin – namely parent repo, commitish, flags, build system, etc. – just from the context of how the tool was run.
There are some cases, however, where the Agent cannot infer origin metadata beyond the origin type. These cases are detailed below.
Carved from PCAP
Thorium can save a lot of useful metadata about files carved from a PCAP (packet capture) sample beyond custom tags (see PCAP Origin for what kind of metadata can be saved). When manually uploading samples, it’s easy to add this information in the Web UI or Thorctl. When the Thorium Agent uploads children files, though, it needs a place to look to grab this information your tool may have extracted.
The special place the Thorium Agent looks is in the thorium_pcap_metadata.json file in the CarvedPCAP origin sub-directory
(/tmp/thorium/children/carved/pcap/ by default). This file should be a JSON map where the keys are children filenames (not absolute
paths) and the values are the metadata to encode. An example thorium_pcap_metadata.json file could look like:
{
    "carved_from_pcap1.hmtl": {
        "src": "1.1.1.1",
        "dest": "2.2.2.2",
        "src_port": 80,
        "dest_port": 34250,
        "proto": "TCP",
        "url": "example.com"
    },
    "carved_from_pcap2.txt": {
        "src": "3.3.3.3",
        "dest": "4.4.4.4"
    }
}
The table in PCAP Origin lists the fields each child file may have. The thorium_pcap_metadata.json file
is completely optional. If no metadata file is provided, all PCAP-carved children will still have the CarvedPCAP origin, just with no
metadata beyond the parent SHA256, the tool that carved out the file, as well as any custom tags your tool sets.
Building Pipelines
What are pipelines?
Pipelines are used to string together one or more Thorium image(s) into a runnable analysis playbook. The simplest possible Thorium pipeline would contain a single pipeline stage that would run a single Thorium image. A more complicated pipeline might consist of multiple stages each containing one or many images. The stages of a pipeline are executed sequentially where each image within one stage must complete successfully before a subsequent stage can start. The images within a pipeline stage may be scheduled to run in parallel by the Thorium scheduler, depending on the available resources. The following table describes the concepts related to how pipelines run:
| Term | Description |
|---|---|
| Image | A tool and it’s associated runtime configuration. |
| Pipeline | An executable playbook of analysis steps called stages, stages are executed sequentially. |
| Stage | A step in a pipeline, each stage can contain multiple images that may run in parallel. |
| Reaction | An instance of a pipeline that runs in one of Thorium’s execution environments. |
| Job | The execution of a single image from a pipeline |
Create a pipeline
Before you build a pipeline, you must have already added a Thorium image to your group. If you have not done that yet, you can read about the process on the Working With Tools page. The following video show a simple pipeline consisting of a single image.
Troubleshooting a Running Pipeline (Reaction)
So what do you do if your pipeline fails to run successfully after you set it up? The logs for the reactions that you run are saved by the Thorium Agent and uploaded to the API. These logs include debug info printed by the Agent as well as all the stdout and stderr produced by the tool your image is configured to run. Reaction logs are critical to help troubleshoot why your pipeline fails when it is scheduled and run.
If your pipeline is stuck in a Created state and appears to never be scheduled to run, you will want to check the image configuration for each image in your pipeline and validate all configured fields. If your review doesn’t find any issues, your local Thorium admins can look at the API and Scaler logs to provide additional debug info.
| Problem | Developer Action |
|---|---|
| Pipeline is never spawned. | Check your image configuration. This may be preventing Thorium from scheduling your image. Verify that Thorium has enough resources to run all images in your pipeline. For k8s images, confirm the registry path for your image is valid. |
| Pipeline fails when scheduled. | Check the reaction logs for the pipeline that failed. For a pipeline to succeed all stages of a pipeline must return successfully and pass back a success return code 0 to the Thorium agent. |
| Pipeline fails and logs a Thorium specific error. | Sometimes Thorium breaks, ask an admin for some assistance. |
| Pipeline completes, but no results are returned. | Check your image configuration. The agent must be told what paths your tool writes analysis artifacts into. If this path is wrong, the agent won’t ingest any tool results for the image. |
Toolboxes
What is a toolbox?
A Thorium toolbox is a portable, self-contained collection of tools — image and pipeline
configurations bundled together so they can be shared between Thorium instances. A toolbox is
described by a single toolbox.json manifest that lists every image and pipeline (along with
their Thorium configs), optionally alongside the container image files themselves for offline
transfer.
thorctl toolbox provides the full lifecycle for working with toolboxes:
| Command | Purpose |
|---|---|
thorctl toolbox init | Scaffold config.toml, image, and pipeline files for a new toolbox |
thorctl toolbox build | Generate a toolbox.json from a directory of manifests |
thorctl toolbox export | Pull images/pipelines out of a running Thorium instance into a toolbox |
thorctl toolbox import | Import a toolbox.json (local file or URL) into a Thorium instance |
thorctl toolbox remove | Delete a previously imported toolbox’s pipelines and images |
thorctl toolbox diff | Show what importing an on-disk toolbox would change, git-diff style |
thorctl toolbox build-images | Build (and --push) the container images in a toolbox locally |
Which command/flag for which task
| You want to… | Use |
|---|---|
| Start a brand-new toolbox by hand | init toolbox (creates config.toml + tool stubs), then build |
| Add one image/pipeline stub to an existing toolbox | init image/init pipeline (positional path = where it lands); pass -c <config.toml> to resolve/validate against the toolbox without moving files |
| Capture tools from a running instance | export (writes the whole repo + toolbox.json) |
| Append more tools into an existing toolbox repo | export -p …/-i … with -o <toolbox-dir> or -c <toolbox-dir>/config.toml (which defaults the output to that dir); the existing config.toml is reused automatically |
| Refresh every tool already in a toolbox from the instance | export -c <toolbox-dir>/config.toml --overwrite (no -g/-p/-i) — re-pulls and updates all existing tools in place |
Seed a new toolbox’s settings from another toolbox’s config.toml into a different dir | init toolbox -c …, or export -c <other>/config.toml -o <new-dir> (explicit -o required) |
| Place one resource’s files in a specific dir | export -i group/name=dest / -p group/name=dest (placement only) |
| Fold an exported image into an existing Dockerfile dir | export -i group/name=<dir-with-Dockerfile> (auto-sets build = true) |
| Set the default export layout | init toolbox --image-path … --pipeline-path … (writes export_*_path in config.toml) |
| Update a matched tool that differs (export) | --overwrite — updates in place (image: Thorium config only, keeps manifest.toml build settings); without it a differing tool is skipped with a warning |
| Overwrite per-tool files | --overwrite (init, import-conflict mode) |
Overwrite config.toml | --overwrite-config (export, init toolbox) |
| Update existing cluster network policies | --update-network-policy (import) |
| Move images to an air-gapped instance | export --with-images, then import --image-path-prefix … |
Toolbox layout
A toolbox is a directory tree. Each tool lives in its own folder with a manifest.toml, a JSON
Thorium config, and (for images) the docker build context. At the root are a config.toml and
the generated toolbox.json:
my-toolbox/
├── config.toml
├── toolbox.json                # generated by `build` (and by `export`)
├── images/
│   └── clamav/
│       ├── manifest.toml
│       ├── clamav.json         # Thorium image config
│       ├── description.md      # image docs (optional); becomes the config's description
│       ├── clamav.tar.gz       # only present in --with-images bundles
│       └── Dockerfile
└── pipelines/
    └── antivirus/
        ├── manifest.toml
        ├── description.md      # pipeline docs (optional); becomes the config's description
        └── antivirus.json      # Thorium pipeline config
Tool docs (description.md)
A tool’s description can live two places: the description field inside its JSON/inline
Thorium config, or a standalone description.md beside its manifest.toml. The Markdown file
exists because authoring a long description as an escaped one-line string inside JSON is
painful — keeping the docs in their own .md file lets you write, diff, and review them as
real Markdown.
Precedence — description.md wins. When toolbox build rolls a tool into toolbox.json,
it reads any description.md next to the manifest, trims trailing whitespace, and writes it
into the config’s description field, replacing whatever the inline config held. If the
inline value was non-empty and differed from the file, the build prints a warning so the
override is visible. If description.md is absent (or present but empty), the inline config’s
description is left untouched. A config that is resolved from a URL at import time
(config_from pointing at a URL) can’t be edited during build, so a description.md beside it
is only warned about, never injected.
toolbox export always writes a description.md for each exported resource — its content is the
resource’s description, or an empty file when the description is unset/empty (never the literal
text null, which would otherwise become the description on re-import). toolbox init scaffolds a
stub. Descriptions surface in the Thorium UI and thorctl images get, so they’re how users — and AI
agents — decide which tool to run.
Toolbox config (config.toml)
Names the toolbox and the registry its images are stored in. The registry may be left empty (for example when exporting a toolbox you intend to push to a registry you don’t know yet).
name = "My Toolbox"
registry = "ghcr.io/org/repo"
# registries = []                 # additional registries to tag images in
# image_path_prefix = ""          # default registry path prefix for bundled images
# export_image_path = "images"    # where `export` places image dirs (relative to the toolbox root)
# export_pipeline_path = "pipelines"
# bundled_images = true           # set automatically by `export --with-images`

# toolbox-wide default base-image config (see "Overriding base images" below)
# [base_image]
# image = "ubuntu:22.04"
# image_arg = "IMAGE"
# token = "BASE_REGISTRY_TOKEN"   # CI/CD variable NAME (pass-through; unused by build-images)
# user = "BASE_REGISTRY_USER"     # CI/CD variable NAME (pass-through)
# allow_override = true
export_image_path / export_pipeline_path set where export writes each tool’s directory
(default images/<name> and pipelines/<name>); set them at scaffold time with
thorctl toolbox init toolbox --image-path … --pipeline-path …. They only affect where export
places files — build discovers manifest.toml files at any depth regardless — and a bundled
image’s tarball travels with its tool directory (each image records that directory in toolbox.json,
so import finds the tarball wherever it was placed).
Image manifest (manifest.toml)
name = "clamav"
type = "image"
config_from = "clamav.json"       # local file or a URL
build_path = "./"
image_name = "tools/github.com/cisco-talos/clamav"
version = "latest"
# build = true                    # set false to reference an already-published image
# exported_image_path = "..."     # a build=false image's real registry url (set by export)
# network policy definitions this image references (local files or URLs)
# network_policies_from = ["restricted.policy.json"]

# per-tool base-image config (merged over the config.toml default; per-tool fields win)
# [base_image]
# image = "alpine:3.19"
# image_arg = "IMAGE"
# token = "BASE_REGISTRY_TOKEN"   # CI/CD variable NAME (pass-through; unused by build-images)
# user = "BASE_REGISTRY_USER"     # CI/CD variable NAME (pass-through)
# allow_override = true
Reusing another image’s container (image_from)
Thorium toolbox images can run the same container image but with different runtime config
(args/env/entrypoint). Instead of giving each its own container, an image can declare image_from
to reuse another toolbox image’s container image by name and version:
name = "clamav-verbose"
type = "image"
config_from = "clamav-verbose.json"   # this image's own runtime config (args, etc.)

[image_from]
name = "clamav"                       # reuse this image's container image
version = "latest"                    # defaults to "latest" if omitted
image_from is resolved at build time: the referenced image’s container url is written into this
image’s config, so on import both are created as distinct Thorium images sharing one container. Notes:
- It forces
build = false— the image is never built (build_path,[base_image], andexported_image_pathhave no effect whenimage_fromis set). - The reused url takes precedence over any
exported_image_pathorimageurl in the config. - This image’s own config must be local (a
config_fromthat is a URL can’t have the reused url embedded at build time). - The referenced image must be a real image the toolbox knows about (with a container image of its
own). An
image_fromthat points at a missing image, forms a cycle, or targets an image that has no container image failstoolbox build—toolbox.jsonis not written, so the broken image and any pipelines that reference it never reach an instance.
Pipeline manifest (manifest.toml)
name = "antivirus"
type = "pipeline"
description = "Antivirus scanners (licenses may be required)"
version = "latest"
config_from = "antivirus.json"

[images.clamav]
version = "latest"
How container image tags are built
When toolbox build assembles toolbox.json, each image’s container url (its image_tags and the
image field embedded in its config) comes from one of three sources:
-
image_from(highest priority) — the url is taken from the referenced image (see above); no tag is derived for this image. -
Pinned url — for an image with
build = falsethat has noimage_from, the url is used verbatim from its manifest’sexported_image_path(recorded bytoolbox export), or failing that theimageurl already in its config. No derivation happens. -
Derived url — for a buildable image (
build = true), and as the fallback for an unpinnedbuild = falseimage, the tag is derived per registry as:<registry>/[<image_path_prefix>/]<leaf>:<version>[<tag_suffix>]<registry>— fromconfig.toml: the primaryregistryplus anyregistriesextras (blanks and duplicates dropped). One tag is produced per registry; the first is written into the config’simagefield, the rest are mirror push targets. An empty registry list means no tag is derived (the config’s ownimageurl stands instead).<image_path_prefix>— optional path fromconfig.toml, inserted between the registry and the leaf when set.<leaf>— the toolname. Passtoolbox build --use-image-pathto use the manifest’simage_name(a repo-style path) as the leaf instead; with that flag, an image with noimage_nameyields no derived tag.<version>— the manifest’sversion(defaults tolatest; an empty version is rejected).<tag_suffix>— optional, appended to the version viatoolbox build --tag-suffix(e.g.-mybranch) so feature-branch builds get distinct tags.
For example
registry = "ghcr.io/o/r"+ toolname = "strings"+version = "latest"derivesghcr.io/o/r/strings:latest; with--use-image-pathandimage_name = "gnu.org/binutils/strings"it derivesghcr.io/o/r/gnu.org/binutils/strings:latest.
A K8s image that ends up with no container tag from any of these sources is unschedulable, so
toolbox build fails and lists every such image. (Non-K8s scalers — BareMetal, Windows, Kvm,
External — run without a container image and are exempt.)
Creating a toolbox from scratch
Use init to scaffold files (it never overwrites existing files unless you pass --overwrite), then
build to roll them into a toolbox.json:
# scaffold a toolbox with one image and a pipeline that runs it
thorctl toolbox init toolbox -i ./images/clamav -p ./pipelines/antivirus:clamav

# generate toolbox.json (reads ./config.toml by default)
thorctl toolbox build
A toolbox is anchored on its config.toml: build crawls and writes relative to the config.toml’s
directory. Both --path (the crawl root) and --output (the toolbox.json location) default to
that directory, so build from a toolbox root “just works” and thorctl toolbox build -c sub/config.toml builds the toolbox in sub/ (writing sub/toolbox.json). The two are independent
overrides — -o dist/toolbox.json redirects only the artifact, --path ./src redirects only the
crawl — and build prints the resolved crawl root and output path when it runs. (Note: build_path
is recorded relative to --output, so a --output outside the crawled tree produces ../-style
build contexts — fine for import, but a build-images-portable toolbox wants the default
self-contained layout.)
init runs interactively by default, prompting for the key fields and optionally opening your
$EDITOR to review the full config. Pass -n/--non-interactive to accept defaults. You can also
scaffold a single image or pipeline with thorctl toolbox init image ./images/clamav or
thorctl toolbox init pipeline ./pipelines/antivirus -i clamav. The positional path is the
destination; the stub is folded into a toolbox by build’s recursive walk wherever it lands.
init image/init pipeline take an optional -c <config.toml> to validate against an existing
toolbox (a resolution source, not a placement directive — it never moves files). init pipeline
guarantees a dangling-free manifest: every --order image must be declared in --images, and with
-c every referenced image must already exist in the toolbox (else it errors — init never creates
images) and is version-pinned from the toolbox instead of defaulting to latest. init image -c
errors if an image of the same name+version already exists in the toolbox (pass --overwrite to
replace). init toolbox remains the command that creates a new toolbox (config.toml + tools).
Building images locally
Forks without CI can build a toolbox’s container images directly. build-images walks
toolbox.json for image entries with build enabled, builds each entry’s docker context with its
first registry tag, aliases the remaining tags onto the same build, and pushes everything with
--push (requires docker and registry credentials):
thorctl toolbox build-images ./toolbox.json --push          # everything buildable
thorctl toolbox build-images ./toolbox.json -i clamav       # just one image
Entries with build = false in their manifest or no image_tags are skipped with a note. Once
the images are pushed, toolbox import works as usual. If an image fails to build or push,
build-images reports it, keeps going with the rest, and exits non-zero at the end listing every
image that failed — one broken image doesn’t block the others.
The container runtime is selected from --container-runtime if given, else the container_runtime
setting in your thorctl config, else an autodetected default (docker/podman).
Two flags control how the underlying docker/podman build runs (both apply to every image built in the run):
--no-cache— build without the layer cache (passes--no-cacheto docker/podman), e.g. to pick up a changed remote dependency a cached layer would otherwise mask.--pull— force a fresh pull of referenced images before building (passes--pullto docker/podman). Like docker/podman--pull, this refreshes every image the build references, including theFROMbase.
thorctl toolbox build-images ./toolbox.json --push --no-cache --pull
Base images ([base_image])
Base-image configuration lives in one [base_image] table, available both toolbox-wide (in
config.toml) and per-tool (in manifest.toml). It can override a tool’s Dockerfile base image and
record the credentials an external CI/CD pipeline uses to pull a private base.
# config.toml (global default) or manifest.toml (per-tool)
[base_image]
image = "alpine:3.19"          # override the Dockerfile FROM base (optional)
image_arg = "IMAGE"            # the build-arg the Dockerfile reads; default "IMAGE"
token = "BASE_REGISTRY_TOKEN"  # NAME of a CI/CD variable (pass-through; see below)
user = "BASE_REGISTRY_USER"    # NAME of a CI/CD variable (pass-through)
allow_override = true          # gates the image/image_arg substitution; default true
Resolution. toolbox build merges the per-tool table over the global one field by field
(per-tool wins) and writes the result onto each image entry in toolbox.json. The
image/image_arg substitution is applied as --build-arg <image_arg>=<image> and is overridden
at build-images time by the --base-image ARG=IMAGE flag, so the effective precedence is CLI >
per-tool > global. Overriding the base requires a parameterized Dockerfile (a build-arg can’t
replace a hardcoded FROM):
ARG IMAGE
FROM ${IMAGE}
allow_override gates the image/image_arg substitution only (default true); set it to
false to keep a tool’s own base. token/user are independent of it.
token/user are opaque pass-through strings — they are intended to hold the names of CI/CD
pipeline variables (do not put real secrets here; toolbox.json is usually committed). thorctl never
resolves or manipulates them, and build-images does not use them (it performs no base-registry
login). If a base image needs auth for build-images, run docker/podman login yourself first.
Defaults / absence. Omitting [base_image] entirely leaves the Dockerfile’s own FROM
untouched (no implicit base). With an image set, image_arg defaults to IMAGE; allow_override
defaults to true; a per-tool field that is omitted inherits the global value. [base_image] is
ignored on image_from images (which are never built).
Exporting from a running instance
export fetches image and pipeline configs from Thorium and writes a complete toolbox directory
(manifests, configs, and a toolbox.json). The real registry URL of each image is preserved
exactly as it is in Thorium.
# export an entire group into a new toolbox
thorctl toolbox export -g static -o ./my-toolbox

# export specific pipelines (their images are pulled in automatically) and standalone images
thorctl toolbox export -p static/antivirus -i static/exiftool -o ./my-toolbox

# append into an existing toolbox by pointing at its config.toml — output defaults to its directory
thorctl toolbox export -c ./my-toolbox/config.toml -p static/newpipeline
The --output/-o directory defaults to the --config directory when --config is given (so
pointing at a toolbox’s config.toml exports into that toolbox), otherwise ./toolbox for a brand-new
toolbox. An explicit -o always wins; the defaulted directory is announced in the output.
Useful flags:
--group-override <group>— rewrite the group of every exported config.--review— open each config in an editor to review/tweak it before writing (off by default, so configs are written as-is).--with-images— also bundle the container image files (see below).--strip-registry— publish a registry-agnostic toolbox: each image config’simageurl is written empty and the manifest’sexported_image_pathis omitted, so a rebuild derives each image path from the toolbox’s ownconfig.tomlregistry/image_path_prefixrather than your pinned url. Images only (pipelines carry no url). Conflicts with--with-images(a bundled import needs the url to tag and push the saved tarball).--overwrite— overwrite existing per-tool files (manifest/JSON/description/policies). It does not touchconfig.toml.--overwrite-config— replace an existingconfig.toml(otherwise it is preserved).
Appending into an existing toolbox is safe by default. config.toml is the toolbox’s identity:
exporting into a directory that already has one preserves it and reuses its settings (announced
in the output) rather than clobbering them, so you don’t need --config. So
thorctl toolbox export -p static/newpipeline -o ./my-toolbox adds the pipeline (and its images)
into ./my-toolbox, and the rebuild folds everything in. Pass --overwrite-config only when you
actually want to change the toolbox’s settings; if a flag like --with-images or --registry
contradicts the preserved config, export warns that the flag is ignored. (--config seeds settings
from another toolbox and anchors the output to that config’s directory unless -o is set — so
-c X/config.toml appends into X, while seeding into a different directory needs an explicit -o.
A --config that points at a missing file isn’t fatal: export warns (“config.toml not found …;
creating a new toolbox there instead of appending”) and creates a new toolbox, so a mistyped or
not-yet-created target shows up as a notice rather than a read error.)
Refreshing a whole toolbox. Running export against an existing toolbox with no
--group/--pipelines/--images and --overwrite re-pulls every tool the toolbox already
contains from Thorium and updates them in place — a one-shot “sync this toolbox to the instance”:
thorctl toolbox export -c ./my-toolbox/config.toml --overwrite # refresh every tool in ./my-toolbox
It enumerates the tool list from the toolbox itself (its toolbox.json, or an on-disk crawl if that’s
gone), updates only tools already present (never adds new ones, never prunes), and warns + leaves
untouched any tool that no longer exists in Thorium. Without --overwrite a no-selection run errors
with a hint (it inherently rewrites the existing configs).
Group as source vs destination, and renames. -g is the source group (what to read from
Thorium); --group-override is the destination group (what to write under in the toolbox),
defaulting to the source group. build identifies an image/pipeline by name + version,
ignoring group, so a tool written under a group that doesn’t match where it already lives in the
toolbox would be a build-breaking duplicate. Export handles this automatically:
# toolbox stores these under a different group than Thorium's "static2"; re-group + update in place:
thorctl toolbox export -g static2 -c ./my-toolbox/config.toml --overwrite
With --overwrite, each existing tool is matched by its name+version and re-grouped in place to
the destination group (the -g group here, or --group-override if you set one) — its files are
rewritten at their existing directory, reported “Re-grouping …”. Without --overwrite, a tool
whose name+version already exists under a different group is skipped with a warning (suggesting
--overwrite) rather than written as a duplicate. (A same name at a different version under
another group is warned but allowed, since build keeps distinct versions.) Refresh-all (no selection)
still fetches by the toolbox’s own group, so use -g <thorium-group> --overwrite to bridge a rename.
When appending into an existing toolbox, export reconciles against it. The existing toolbox is read
from its committed toolbox.json; if that file is missing or unparsable, export falls back to crawling
the on-disk tool manifests, so a deleted or stale toolbox.json doesn’t make the append re-write what’s
already there. Each image and pipeline records its on-disk directory in toolbox.json, so a re-export
updates a tool where it already lives instead of writing a duplicate at the default layout. Per
matched tool (group/name):
- unchanged (byte-identical config) → a no-op, and the container re-bundle is skipped when the tarball is already saved (reported “Unchanged”);
- differs, with
--overwrite→ updated in place. For an image this refreshes only the Thorium config (<name>.json), description, and policy defs and keeps itsmanifest.toml(so hand-setbuild/build_path/[base_image]/image_fromsurvive); a pipeline manifest is regenerated; - differs, without
--overwrite→ skipped with a warning suggesting--overwrite, and the rest of the export continues; - an explicit
=dirpointing somewhere other than where the tool already lives → skipped (a second copy would failbuild); omit=dirto update in place.
A fresh export (no existing toolbox) does none of this. Note: an image update preserves the manifest,
so a change to the image’s network-policy set in Thorium won’t re-link network_policies_from — use
=dir (a full write) or remove + re-export to pick that up.
Placing a single resource (=dir). A -i/-p entry may carry a group/name=dir suffix to
write that resource’s files into a chosen directory instead of the configured/default layout — for
example to fold a Thorium image config into a directory that already holds its Dockerfile:
thorctl toolbox export -i static/clamav=tools/clamav -o ./my-toolbox
# writes tools/clamav/{manifest.toml, clamav.json, description.md, *.policy.json}
dir may be relative or absolute. A relative dir is interpreted against the toolbox root; an
absolute one is taken literally; either is normalized and re-expressed relative to the root — so an
explicit path into a toolbox elsewhere works, e.g. with -c ../../other/tb/config.toml you can write
-i static/clamav=../../other/tb/tools/clamav (it lands at tools/clamav inside that toolbox). The
only rule is that it must resolve inside the toolbox root; a dir that lands outside is rejected
(build only includes files under the toolbox).
=dir is placement only — it never changes which pipeline or images are selected (a pipeline’s
membership and order come from Thorium). Placement precedence per resource is: explicit =dir → the
directory the tool already occupies in the toolbox (so re-exports update in place) → the
configured/default layout. Whole-group exports and auto-pulled dependency images aren’t named, so they
reuse their existing directory or the configured/default layout unless an image is also named with its
own =dir.
If the =dir destination already contains a Dockerfile, export reads it as a build context you are
folding the config into and writes that image’s manifest.toml with build = true (and no
exported_image_path), so a later build builds the image from that context rather than referencing
the original registry url:
# tools/clamav/ already holds a Dockerfile
thorctl toolbox export -i static/clamav=tools/clamav -o ./my-toolbox
# clamav.json + manifest.toml (build = true) land beside the existing Dockerfile
This auto-detect applies only to the explicit-=dir case (a default-layout dir is created fresh and
never holds a Dockerfile); the default build = false reference-only manifest is used everywhere
else. The detection is announced with a log line.
Importing into an instance
import reads a toolbox.json from a local path or a URL and creates the images, pipelines, and
any missing groups in the target Thorium instance.
thorctl toolbox import ./my-toolbox/toolbox.json
thorctl toolbox import https://raw.githubusercontent.com/cisagov/thorium/refs/heads/main/tools/toolbox.json
If an image or pipeline already exists, the conflict is handled according to one of three modes (new resources are created in all of them):
| Mode | Flag | Behavior for existing resources |
|---|---|---|
| Interactive (default) | — | Prompts per changed resource: Edit (resolve a git-style diff in your $EDITOR), Skip, Apply (accept incoming), or Quit |
| Overwrite | --overwrite | Applies every incoming change without prompting |
| Skip conflicts | --skip-conflicts | Never touches existing resources; logs a warning per skipped resource listing the fields that differ |
--overwrite and --skip-conflicts are mutually exclusive. The upfront confirmation screen
(shown before an interactive merge or before creating new groups/network policies) only appears
in the default interactive mode on a real terminal; passing --overwrite or --skip-conflicts,
or running without a TTY (CI, pipes), skips it. --skip-conflicts is therefore the fully
unattended form for CI and agents that must never overwrite local changes.
--group-override <group> forces everything into a single group.
Diffing a toolbox against an instance
diff shows what an import of a toolbox would change, rendered like git diff. It accepts a
toolbox.json (path or URL) or a toolbox repo directory — directories are built in-memory from
their manifests, so the diff always reflects the configs as they sit on disk:
# compare a repo checkout against the instance it was imported into
thorctl toolbox diff ./my-toolbox --group-override sandbox

# gate CI on drift (exit 1 when anything differs, like git diff --exit-code)
thorctl toolbox diff ./my-toolbox/toolbox.json --exit-code
diff runs the toolbox through the same pre-processing as import before comparing, so what
it shows is what an import would actually apply: structural validation, group capture, any
--group-override, group-coherence validation, and collision resolution (the automatic renames
import performs when two toolbox resources would collide). Resources dropped by validation are
warned about and excluded from the diff, exactly as import would drop them.
Changed resources show unified hunks over their normalized configs (server-only fields like
creators and bans never appear as drift). A resource present on only one side is reported on a
single line rather than a full-body add/delete: resources only in the toolbox as
only in toolbox/<group>/<name> (…) — not in <host[:port]>, and resources in the toolbox’s groups
that the toolbox doesn’t name as only in <host[:port]>/<group>/<name> (…) — not in this toolbox.
The instance is named by its host (and explicit port, if any), and changed resources use that same
<host[:port]>/<group>/<name> header on their instance side. Bundled network policies are included
the same way — toolbox-only ones as a single line, mismatched ones as notes (imports never update
policies). A trailing summary counts changed / only in toolbox / only in <host[:port]> / unchanged.
--exit-code reflects only what an import would change. It exits 1 when there is an
actionable difference — a changed resource, a toolbox-only resource that import would create, or a
network policy that differs — and 0 otherwise. Resources that exist only on the instance are
informational (import never deletes), so they do not trip a non-zero exit on their own.
Network policies
Images can reference Thorium network policies by name, and a toolbox carries the policy definitions so those references stay valid on import:
toolbox exportwrites each referenced policy to<image dir>/<name>.policy.jsonand records it in the image’smanifest.tomlundernetwork_policies_from(the same policy referenced by several images is written to each — identical duplicates dedupe on import). Each exported policy’sgroupsare scoped to the group of the image that references it (and rewritten by--group-override), so a bundled policy never carries groups the toolbox isn’t exporting.toolbox buildbundles those files intotoolbox.json; URL entries are fetched at import time likeconfig_from. A toolbox carrying two different definitions under one policy name fails validation before anything is applied.toolbox importcreates missing policies (with--group-overrideapplied to their groups) before any images. A policy that already exists in the target is never updated — if it doesn’t 100% match the bundled definition, a warning names the differing fields and the target’s policy is left alone. Created policies are part of the rollback journal.
Removing a toolbox
remove deletes the pipelines and images named by a toolbox manifest from the target instance —
pipelines first, then images. Resources that don’t exist are reported and skipped; groups are
never deleted. Pass --group-override if the toolbox was imported with one:
thorctl toolbox remove ./my-toolbox/toolbox.json --group-override sandbox
Single resources can be deleted directly with thorctl images delete <name...> -g <group> and
thorctl pipelines delete <name...> -g <group> (both confirm first; -y to skip).
Offline transfer with bundled images
To move a whole toolbox — including the container images — to an air-gapped Thorium instance, bundle the image files on a connected host and push them into the offline registry on import. You do not need to know the offline registry when exporting.
1. On a connected host, export with --with-images. Each image is docker pulled and saved to
images/<name>/<name>.tar.gz, and the toolbox is marked as bundled:
thorctl toolbox export -g static --with-images -o ./offline-toolbox
Bundling is best-effort: an image that can’t be pulled or saved is warned about and skipped, and the
rest of the toolbox is still written (the skipped image simply ships no tarball and keeps its
original registry URL). Because that leaves the bundle incomplete, export then prints an
INCOMPLETE summary and exits non-zero — so a scripted export → import handoff doesn’t treat a
toolbox with missing tarballs (or an omitted, dangling network policy) as a complete one. A clean
export exits 0.
2. Move the ./offline-toolbox directory to the offline environment (it is fully
self-contained).
3. On the offline host, import and provide the target registry base path with
--image-path-prefix. Each bundled image is loaded, retagged to
<image-path-prefix>/<group>/<name>:<tag>, pushed, and the imported image’s config is rewritten to
point at the offline registry:
thorctl toolbox import ./offline-toolbox/toolbox.json \
    --image-path-prefix registry.offline.local:5000/team
# clamav (group "static") -> registry.offline.local:5000/team/static/clamav:latest
If you omit --image-path-prefix for a bundled toolbox, the prefix recorded in the manifest is
used; otherwise you are prompted for one — and if the session can’t prompt (--overwrite,
--skip-conflicts, or no TTY), the import errors instead. The on-disk bundle always keeps the
original image URLs, so it remains re-importable to additional environments. Bundled imports
require docker and must be run from a local path (not a URL).
Pushing the bundled images is best-effort: if an image can’t be loaded, retagged, or pushed, the import warns and continues. The image’s config is still created in Thorium pointing at the offline registry, so once you push that image manually (or re-run the import) the resource works — a single unpushable image doesn’t block the rest of the import. A run that finished with any failed pushes exits non-zero and lists them.
Note:
--with-images/--image-path-prefixneed a container runtime (docker/podman) on the host to actually move images. There is no up-front capability check: if no runtime is available, every image is simply skipped (warned) and the export exits non-zero as incomplete, rather than failing fast. A toolbox exported without--with-imageskeeps each image’s original registry URL, so importing it simply points Thorium at the existing registry — no image transport happens.
Note: KVM-scaled images round-trip their
kvmsettings, but the underlying VM disk image is not part of any export — Thorium has no transport for VM disks. An imported KVM image is creatable but will not run until its disk is moved to the target environment out of band.
Toolbox vs images/pipelines export
thorctl images export|import and thorctl pipelines export|import move a single image or
pipeline (with its container files) between instances and are ideal for one-off transfers and
fine-grained registry control (--registry, --registry-override, --migrate-registry). Reach
for a toolbox when you want to package many images and pipelines together as one portable,
versioned unit — to publish a curated set of tools, share them via a URL, or move an entire
collection (optionally with images) to another instance.
The plain import commands use the same three conflict modes as toolbox import (interactive
merge by default, --overwrite, --skip-conflicts), show the same confirmation summary (shown
only on an interactive terminal; --skip-conflicts or a non-TTY session bypasses it), and
auto-create the target group if it doesn’t exist.
pipelines import imports the images referenced by each pipeline’s order first, then the
pipeline itself, all under one rollback journal: if the import stops early (an error, or Quit
in the merge editor), you are offered a rollback of everything applied so far — or pass
--rollback-on-failure for non-interactive runs. Rollback only undoes Thorium state; registry
pushes are left in place.
Reaction Status
Reactions are instances of a running pipeline. As described in the Building Pipelines chapter, pipelines consist of multiple sequentially executed stages where each stage can run multiple images in parallel. Each reaction you run has its own status and you can view those statuses in the Web UI.
The following table explains each possible reaction status:
| Status | Meaning |
|---|---|
| Created | The reaction has been created, but is not yet running. |
| Running | Atleast one stage of the reaction has started. |
| Completed | This reaction has completed successfully. |
| Failed | The reaction has failed due to an error. |
On the file details page, you will see a list of reactions that have been run on the file.

If you hover over and then click a specific reaction, you will be redirected to the reaction status page. This page shows the status of pipeline jobs, the overall reaction status, and reaction logs. You are also provided a link to the reaction status page when you initial submit a reaction via the Web UI:
If you are using Thorctl to generate your analysis reactions, you can also watch the status of reactions
you create on the command line using --watch or -w.
$ thorctl reactions create --group demo --pipeline testpipeline -f
CODE | PIPELINE                  | SAMPLES                                                          | ID                                   | MESSAGE
-----+---------------------------+------------------------------------------------------------------+--------------------------------------+----------------------------------
200  | testpipeline              | 85622c435c5d605bc0a226fa05f94db7e030403bbad56e6b6933c6b0eda06ab5 | a0498ac4-42db-4fe0-884a-e28876ec3496 | -
-----+---------------------------+------------------------------------------------------------------+--------------------------------------+----------------------------------

	WATCHING REACTIONS

STATUS       | PIPELINE                  | ID
-------------+---------------------------+--------------------------------------
...
Viewing Reaction Status and Logs (Web UI)
You can use the reaction status page to view the state of any reaction, the reaction’s logs, and info about the different stages of the reaction. Links to reactions are provided when submitting new pipelines via the Web UI upload or file details pages.
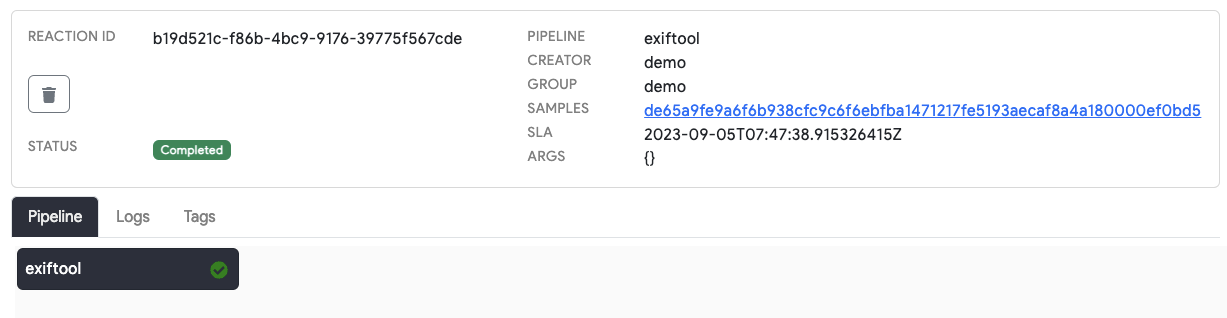
The logs tab will show a summary of the overall reaction, including info about when each stage starts and is completed.
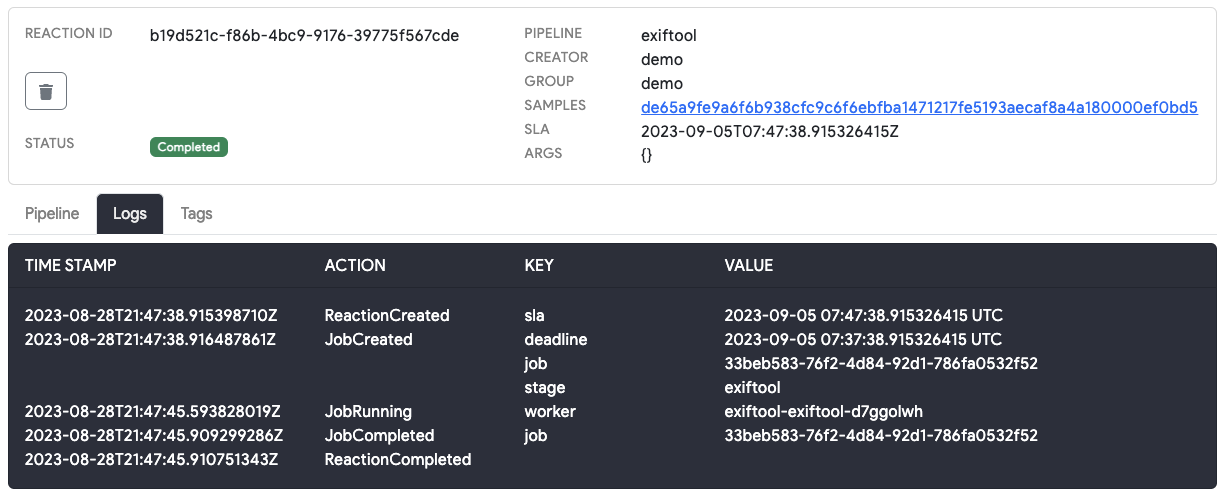
Viewing Reaction Stage Logs (Web UI)
If you want to view the logs of a tool that runs within an individual reaction stage, hover over the image name and click. This will open the stage logs for that stage:
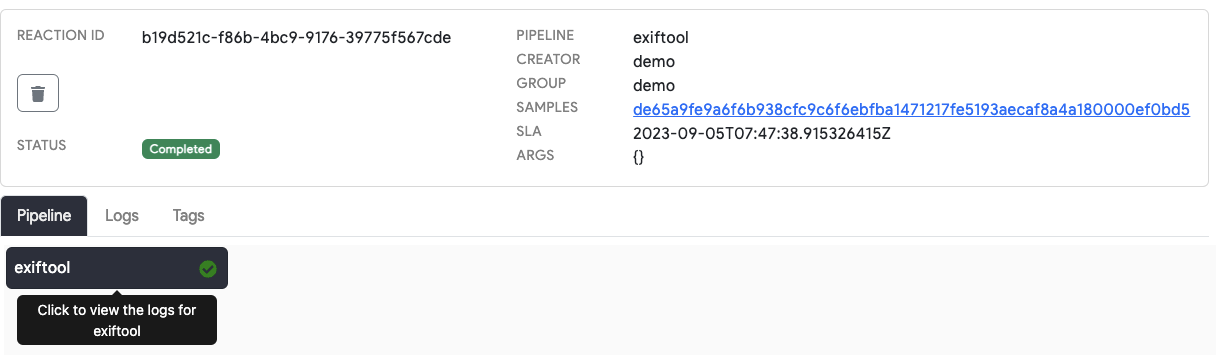
You will see the combined log output of the running tool and the Thorium agent that executes the tool. The agent is responsible for downloading any repos/files needed to run the reaction and then cleaning up after the tool has completed. During this cleanup process any children files and tags will be uploaded to Thorium. In between this setup and cleanup phases, you will see any stderr/stdout that is produced when the tool runs. These logs are also useful for validating the command lines that were passed to the tool when it is run.
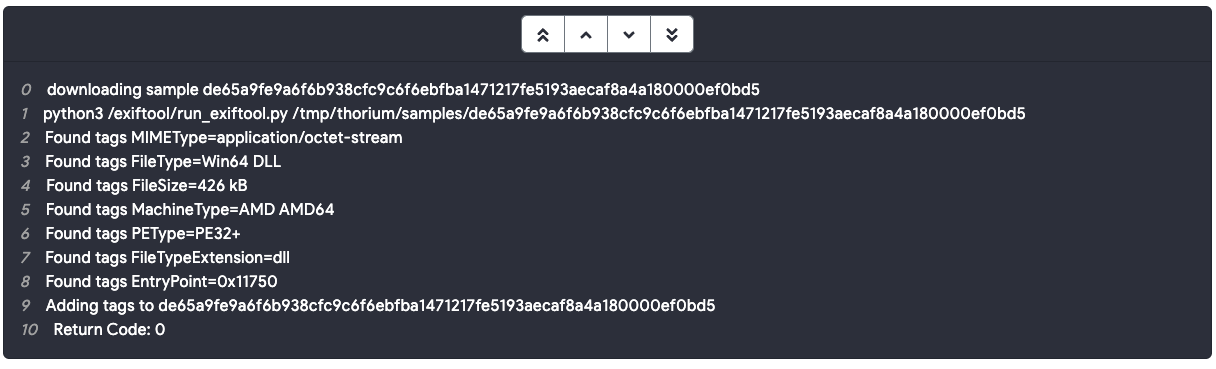
The following video shows the full reaction submission and status monitoring process:
Generators
Generators allow developers to programatically spawn pipelines in Thorium. This means a pipeline can behave like an event loop spawning reactions and then acting on their results or some other events. An example of this would be a pipeline that lists data in Thorium and spawns reactions for each item.
Generators Lifecycle
The lifetime of generators in Thorium can be shown by the following flowchart:

Each time the generator sleeps it will not be rescheduled until all the sub-reactions it spawned reach a terminal state (completed/failed). When it is respawned it will be given the checkpoint info it set previously. This allows it to pick back up where it left off. When spawning sub-reactions it is highly recommended to spawn a limited number of sub-reactions each loop. This number depends on how long the target image pipeline takes to complete but 500-1000 is a good rule of thumb.
Sleep/Respawn
In order to respawn after its sub-reactions are complete, the generator must signal to Thorium that it should be put in a sleeping state before exiting. If the generator exits without sending the sleep request, Thorium will finish the generator job and refrain from respawning it.
You can tell Thorium to sleep a generator by POSTing to this URL:
<API_URL>/reactions/handle/:job_id/sleep?checkpoint=<checkpoint>
The generator receives its job_id from Thorium from the --job kwarg.
Checkpoints
A checkpoint is a custom string that can be given to a generator to give it
context from its previous run. Checkpoints are passed to the reaction with the
--checkpoint kwarg.
For example, a generator might spawn 50 reactions then send a sleep request
with the checkpoint "50". When the generator respawns, it will be run with the
kwarg --checkpoint 50. This way, the generator can keep a running count for
how many sub-reactions it has spawned. Checkpoints can also be used to simply
signal to the generator that it’s been respawned at all.
Authentication
In order to send requests to Thorium from inside the generator (e.g. sleeping the
generator job, creating reactions, etc.) the generator will need to
authenticate with Thorium. The auth token for the currently running user is saved
in a keys file located at /opt/thorium-keys/keys.yml, which will look something
like the following:
api: https://<THORIUM-API-URL>
token: <TOKEN VALUE>
The Rust and Python Thorium clients both natively support this key file and provide convenient functions to build clients just with a path to the file. All requests with the client will then be properly authenticated as the user who originally created the generator reaction.
Though not recommended, you can also manually send HTTP requests using tools
like curl. To authenticate properly, the auth token must be added to the
request header at the key Authorization with the value token <TOKEN-BASE64>,
where <TOKEN-BASE64> is the token encoded in base64.
Example
If we extend previous example with the following requirements:
- List files in Thorium
- Spawn the Inspector image on files tagged with
Submitter=mcarson
Then our generators logic would look like:

FAQ
When will my generator get respawned?
Generators are respawned when all of the sub-reactions they created reach a final state (completed or error).
Why should generators limit how many jobs they create per generation loop?
Drip feeding jobs into Thorium instead of adding them all at once lowers the burden on the Thorium scheduler by avoiding creating millions of jobs at a time.
How do I get reaction/job ID’s for my generator?
Thorium will pass the generator’s reaction/job ID’s to the generator with the
--job/--reaction kwargs, respectively.
Bans
If you’re a Thorium admin looking for instructions on adding/removing bans, see Ban Things in Thorium.
“Bans” in Thorium are applied to entities that are misconfigured or noncompliant such that they cannot “function” (e.g. an image cannot be scheduled, a pipeline cannot be run). As entities can have multiple bans, entities are effectively “banned” when they have one or more bans and are “unbanned” when all their bans are resolved/removed.
Bans work hand-in-hand with Notifications to inform developers why their tools cannot be run. If an image/tool is banned, a notification is automatically created to explain the reasoning behind the ban. Most bans are applied automatically by the API or scaler, but Thorium admins can also “ban” (or perhaps more accurately, “indefinitely disable”) tools/pipelines at their own discretion and provide a reason to the developer.
How Do I Know When Something’s Banned?
Let’s say we’re trying to run a pipeline called harvest in the corn group, but it’s been banned for some reason.
When we try to run harvest, we’ll get an error similar to the following:
Error: Unable to create reactions: Code: 400 Bad Request Error:
{"error":"Unable to create reaction(s)! The following pipelines have
one or more bans: '[\"corn:harvest\"]'. See their notifications for details."}
The error instructs us to check the pipeline’s notifications for details on the ban(s). We can do that using Thorctl:
thorctl pipelines notifications get corn harvest

[2024-10-31 22:13:00.800 UTC] ERROR: The image 'sow' has one or more bans! See the image's details for more info.
[2024-10-31 22:30:52.940 UTC] ERROR: The image 'water' has one or more bans! See the image's details for more info.
We got two notifications explaining that the sow and water images in our pipeline were banned. We can view their notifications
with Thorctl as well:
thorctl images notifications get corn sow

[2024-10-31 22:13:00.800 UTC] ERROR: Please decrease
your memory resources requirements to 64Gi maximum


thorctl images notifications get corn water

[2024-10-31 22:30:52.940 UTC] ERROR: The image volume 'corn-vol'
has a host path of '/mnt/corn-vol' that is not on the list of allowed host
paths! Ask an admin to add it to the allowed list or pick an allowed host path.
It looks like sow has a ban likely manually created by an admin instructing us to decrease the image’s resource
requirements. Meanwhile, water has a host path volume with a mount not on the allowed list. Once we address this issues
and inform a Thorium admin, the bans will be lifted and we can again use our pipeline.
Viewing Bans in an Entity’s Metadata
A ban’s notification should contain all the relevant info regarding a ban, but you can also see the ban
itself in the affected entity’s metadata. You can view an entity’s bans together with its metadata by
using the entity’s respective describe command in Thorctl. By default describe prints a
human-readable summary that lists any bans. To get the full raw data, including the complete ban
records, pass --format json. For images, you would run:
thorctl images describe <IMAGE> --format json
This will output the image’s data in JSON format, including the image’s bans:
{
    "group": "<GROUP>",
    "name": "<IMAGE>",
    "creator": "<USER>",
    ...
    "bans": {
        "bfe49500-dfcb-4790-a6b3-379114222426": {
            "id": "bfe49500-dfcb-4790-a6b3-379114222426",
            "time_banned": "2024-10-31T22:31:59.251188Z",
            "ban_kind": {
                "Generic": {
                    "msg": "This is an example ban"
                }
            }
        }
    }
}
Bans/notifications are currently not viewable in the Web UI, but this feature is planned for a future release of Thorium!
Ban Types
Below are descriptions of the entities that can be banned, the types of bans they can receive, and what to do to lift the ban.
Image Bans
Image bans are applied when an image is misconfigured in some way. The image will not be scaled until the issue is resolved.
The types of image bans are described below.
Invalid Host Path
An invalid host path image ban is applied when an image has an improperly configured host path volume.
Thorium admins can specify a list of paths that developers can mount to their images as a host path volume (see
the Kubernetes docs on host paths for more details).
This list of allowed paths is called the Host Path Whitelist. If an admin removes a path from the whitelist that was
previously allowed, any images that configured host path volumes with that path will be automatically banned.
The ban (and associated notification) will contain the name of the offending volume and its path so developers can quickly reconfigure their images. Removing or reconfiguring the problematic volume will automatically lift the ban. Images with multiple invalid host path volumes will have multiple bans, one for each invalid host path.
Invalid Image URL
⚠️ This ban type is not yet implemented! It will be applied in a future release of Thorium.
An invalid image URL ban is applied when an image has an improperly configured URL. If the scaler fails to pull an image at its configured URL multiple times, it will automatically apply a ban for an invalid URL.
The ban’s description and associated notification will contain the invalid URL that led to the error. The ban is removed once the developer modifies the image’s URL, at which point the scaler will attempt to pull from the new URL (applying a new pan if the new URL is also invalid).
Generic
A generic image ban is applied to an image if no other image ban type is applicable or if an admin applied the ban manually for any arbitrary reason.
Generic bans must contain a description detailing the reason for the ban which can be found in the ban’s associated notification. Generic bans must be manually removed by a Thorium admin.
Pipeline Bans
Pipeline bans restrict entire pipelines from being run. Rather than banning at the scaler as with image bans, pipeline bans apply at the API and prevent reactions with the banned pipeline from being created in the first place. The API responds to the reaction creation request with an error containing the reason the pipeline was banned.
The types of pipeline bans are described below.
Invalid Image
An invalid image pipeline bans is applied when a pipeline has one or more images that are banned. This is the most common type of a pipeline ban.
Pipeline bans for invalid images and their associated notifications will have the name of the offending image. Resolving the image’s ban(s) or removing the image from the pipeline will automatically lift the ban. Pipelines with multiple banned images will have multiple bans, one for each banned image.
Generic
A generic pipeline bans is applied if no other pipeline ban type is applicable or if an admin applied the ban manually for any arbitrary reason.
Generic bans must contain a description detailing the reason for the ban which can be found in the ban’s associated notification. Generic bans must be manually removed by a Thorium admin.
Notifications
If you’re a Thorium admin looking for instructions on creating/deleting notifications, see Create Notifications.
Notifications are short pieces of information regarding specific entities in Thorium. They are often automatically created when an entity is banned to inform the user of the ban and the reason for it (see Bans), but they can also be manually created by Thorium admins.
Notification Levels
Notifications are assigned a level depending on their severity, similar to log levels in other programs. Below is a table of levels and a description of each one:
| Level | Description | Expires by default? |
|---|---|---|
| Info | The notification provides some helpful information about the entity that has little or no bearing on its function | Yes |
| Warn | The notification warns users of a possible issue with the entity that may affect its function but doesn’t completely disrupt it | Yes |
| Error | The notification alerts users of a serious issue that impedes the function of the entity | No |
When an entity receives a ban, a notification at the Error level is automatically created for the entity. The notification
is automatically deleted when the ban is deleted. If an entity has multiple bans, the entity will have multiple notifications,
one for each ban.
Notification Expiration
Notifications can automatically “expire” (be deleted) according to the retention settings in the Thorium cluster config
(7 days by default). The third column of the above table defines the default expiration behavior of each notification level,
specifically that the Info and Warn levels will expire by default while the Error will not. This is because Error
notifications are most often associated with bans and should only be deleted once the ban has been removed. Levels’ expiration
behaviors can be overridden on notification creation (see
Creating Notifications - Expiration Behavior for more info).
Viewing Notifications
Thorctl
Image Notifications
You can view notifications for an image with Thorctl with the following command:
thorctl images notifications get <GROUP> <IMAGE>
This will provide a list of the image’s notifications color-coded to their level (blue for Info, yellow for Warn, and red for Error).
Pipeline Notifications
You can view notifications for a pipeline with Thorctl with the following command:
thorctl pipelines notifications get <GROUP> <PIPELINE>
This will provide a list of the pipeline’s notifications color-coded to their level (blue for Info, yellow for Warn, and red for Error).
Web UI
Notifications are currently not viewable in the Web UI, but this feature is planned for a future release of Thorium!
Admins
The Thorium admin role is responsible for curating and maintaining resources in Thorium. As such, an Admin can view, modify, or delete any resource within Thorium without restriction. An admin may use the Web UI, Thorctl, or a third party API client (Insomnia, Postman, etc) to interact with Thorium. Not all functionality that has been implemented in the restful API is supported via the Web UI or Thorctl. As such, admins may need to use an an API client to make direct web requests to the API.
Whats next?
Before you begin your journey as an admin, we recommend you familiarize yourself with Thorium’s getting_started and components. After that, you are ready to start operating your Thorium cluster. If you have not yet deployed your Thorium instance, you can read a description of how to setup an example deployment.
Architecture
Since Thorium is a distributed system, it has many components that work together to facilitate file analysis. The core components are:
- API
- Scaler
- Agent
- Reactor
- Event Handler
- Search Streamer
- Tracing/Logging
API
The core of the Thorium software stack is a restful API. The API is responsible for allowing all the pieces of Thorium to coordinate and accomplish tasks as a group. The API is built so that many instances of it can run on different servers to enable high availability (HA) and horizontal scalability. If one server that runs an API instance fails, Thorium will continue to operate. Being horizontally scalable also enables Thorium to support a variety of deployment sizes while tailoring resource usage to your workload.
Uploads/Downloads
The Thorium API streams data wherever possible when responding to user requests. This means that when a 1 GiB file is uploaded to Thorium, it will not store the entire file in memory at once. Instead, the API will stream it to S3 in at least 5 MiB chunks. This drastically reduces latency and the required memory footprint of the API. The same is also true for downloads, but instead of 5 MiB chunks, data is streamed to the client as quickly as possible with no buffering in the API.
FAQS
How large of a file can I upload?
This is limited to the chunk size the API is configured to use on upload. By default, this chunk size is set to 5 MiB which allows for a max size of ~48.8 GiB.
Why does the API buffer uploads in 5 MiB chunks?
This is the minimum chunk size required by S3 for multipart uploads.
What databases does the API require?
A variety of databases are used to store different resources:
| Database | Use Case | Example Resources |
|---|---|---|
| Redis | Low latency/high consistency data | reactions and scheduling streams |
| Scylla | Higly scalable/medium latency data | file metadata, reaction logs |
| Elastic | Full text search | tool results < 1 MiB |
| S3 | Object storage | all files, tool results > 1MiB |
| Jaeger | Tracing | API request logs |
Scaler
Thorium scalers are responsible for determining when and where reactions/jobs are spawned. It accomplishes this by crawling the deadline stream and based on fair share scheduling logic. This means that some portion of your cluster will be dedicated to the most pressing jobs based on deadline while another portion will be trying to fairly executing everyones jobs evenly. This allows for users to spawn large groups of reactions/jobs without fear of abusing the cluster and preventing others from accomplishing tasks.
The scaler currently support 3 scheduling targets:
- Kubernetes
- Bare metal
- Windows
Scheduling Algorithms
The scaler uses a pool based scheduling system where each pool has its own resources that are allocated based on their own scheduling algorithm. The current pools in Thorium are:
- Deadline
- Fair share
Deadline Pool
The deadline pool is scheduled in a first come first serve basis based on the deadline set by the SLA for specific images. This means that jobs earlier in the deadline stream will get priority over jobs later in the queue. It is intended to ensure that some portion of the cluster is always working to meet the SLA for all jobs. A downside of this is that heavy users can cause other users jobs to be stuck in the created state for a long period of time.
Fair Share Pool
The fair share pool is intended to balance resources across users, not images, resulting in responsive execution of jobs even when heavy users are active. This is accomplished by the scaler scoring users based on their currently active jobs across all pools. The score increased is based on the resources required for their currently active jobs. When scheduling jobs for the fair share pool the users with the lowest score will get the highest priority.
workers that are spawned in the fairshare pool will have a limited lifetime depending on their original lifetime settings.
| original | under fair share |
|---|---|
| None | Can claim new jobs for 60 seconds before terminating |
| Time Limited | Can claim new jobs for up to 60 (or a lower time specified limit) seconds before terminating |
| Job Limited | Can claim a single job |
This limit is in place to ensure workers spawned under fairshare churn often to allow for resources to be shared across users with minimal thrashing.
Scaler FAQ’s
Why do we only preempt pods when we are above 90% load
This is to prevent us from wasting resources spinning pods down when we have free resources still. If there are no jobs for that stage it will spin itself down but if we have free resources then allowing them to continue to execute jobs lowers the amount of orphaned jobs.
Does Thorium’s scaler hold the full docker image in its cache?
No the Thorium scaler doesn’t download or have the full image at any point. It does however contain metadata about docker images. This is what allows the scaler to override the original entrypoint/command while passing that info to the agent.
I see an External scaler what is that?
Thorium allows users to build their own scaler and purely use it as a job/file metadata store. To do this you will set your images to use the External scaler.
Agent
The Thorium agent facilitates the running of tools within a reaction by:
- Downloading all required job data (samples, repos, etc.)
- Executing tool(s) during the job
- Streaming logs to the API
- Uploading results to the API
- Cleanup of some temporary job artifacts
This functionality allows Thorium to support arbitrary command line tools with limited to no customization of the tool itself. The agent interacts with the API, abstracting all required knowledge of the Thorium system away from the tool. As a result, any tool that can be run from a command line interface on bare-metal or in a containerized environment can be integrated into Thorium with minimal developer effort.
FAQs
How does the agent know what commands are required to run tools?
This depends on what type of scheduler this agent was spawned under:
| Scheduler | Method |
|---|---|
| K8s | The scaler inspects the Docker image in the registry |
| Windows | The scaler inspects the Docker image in the registry |
| Bare Metal | The Thorium image configuration contains an entry point and command |
| External | Thorium does not spawn this and so it is left up to the spawner |
Does the agent clean up after my tool runs?
The Thorium agent will cleanup certain artifacts after a reaction has completed. This includes any data that was downloaded from the API at the start of a reaction and provided to the tool before it was executed. The directory paths set in the Thorium image configuration for input files, repos, results, result files and children files will all be cleaned up by the agent. If a tool uses directories outside of those set in the Thorium image configuration, the agent will not know to clean those up. Instead it is up to the tool to ensure those temporary file paths get cleaned up. For containerized tools, any file cleanup not handled by the Agent or tool itself will automatically occur when the image is scaled down.
Reactor
While we can rely on K8s to spawn workers that is not true on bare metal systems or on Windows. To replicate this Thorium has the reactor. The Thorium reactor periodically polls the Thorium API for information on its node and spawns/despawns workers to match. This allows us to share the same agent logic across all systems without making the agent more complex.
Reactor Types
Thorium supports several types of reactors:
KVM Reactor
The KVM reactor manages virtual machines using libvirt/KVM. It’s designed for Linux systems and provides isolated environments for analysis jobs.
Key Features:
- Manages pre-configured VMs using overlays of golden images
- Uses the QEMU guest agent to transfer and launch the Thorium agent
- Manages the full VM lifecycle, cleaning up resources on exit and error
Setup Guide: For detailed instructions on configuring VMs for the KVM reactor, see the KVM VM Setup Guide.
Bare Metal Reactor
The bare metal reactor runs jobs directly on the host system without virtualization. This provides maximum performance but with less isolation.
Windows Reactor
The Windows reactor manages Windows containers on Windows host systems.
How the Reactor Works
- Polling: The reactor periodically checks the Thorium API for the current state of its node
- Worker Management: It compares the desired state with the current state and spawns/shuts down workers accordingly
- Lifecycle Management: For each worker, the reactor handles the complete lifecycle from creation to cleanup
- Resource Tracking: It monitors resource usage and reports status back to the Thorium API
Tracing/Logging
Thorium leverage tracing to accomplish logging. Tracing is very similar to logging but with several advantages:
- Unified trace/log viewing/aggregation
- Traces provide richer information then conventional logs
Unified Tracing
With conventional logging you are logging to a central file server or to disk (unless you feed your logs to elastic or another service). This means that when a problem occurs you may have to find the node that a service was running on to look at the logs. Then if the problem spans multiple nodes your are looking across multiple nodes trying to correlate logs. This is greatly exacerbated in Kubernetes as if an error takes down a pod then its logs can also be lost.
By leveraging tracing however we can log to both stdout and to a trace collector at once. This means that admins can look at logs normally but can also use the Jaeger webUI to view traces for all services in Thorium. Jaeger allows for admins to search for tags by any of the logged fields or by span type. This makes it much easier to locate problems in Thorium.
Richer Information
Exposing tracing in a webUI allows for much richer information to be exposed compared to conventional logging. This is largely because you can minimize what information is displayed at any given point unlike logs in a file. It also retains the parent child relationship of events allowing you to see that some action took place as part of a large action. The final aspect tracing provides over traditional logging is timing information. You can see how long actions take allowing you to find what operations are slow or causing problems.
Event Handler
The event handler in Thorium is responsible for triggering reactions based on events in Thorium. An event in thorium is an action taking place like:
- Uploading a file/repo
- Creating tags
When these event happen they are pushed into a stream in redis. The event handler then pops events from this stream and determines if the conditions for a pipeline trigger have been met. If they have then a reaction will be created for the user whose event met this triggers conditions. A single event can trigger multiple distinct triggers.
Event Handler FAQ’s
Is there a delay between events being created and being processed
Yes, the event handler trails live events by 3 seconds. This is to ensure that Scylla has a chance to become consistent before the event handler process an event. Event though event data is stored in Redis the event-handler often has to query for additional data to determine if a trigger’s conditions have been met. This data is stored in Scylla and so requires some time to become consistent.
What stops an infinite loop in events?
Triggers have an configurable depth limit meaning any events that reach that limit will be immediately dropped instead of processed.
Can I replay events?
No, once an event is processed it is dropped and cannot be replayed.
Deploy Thorium on Kubernetes (K8s)
This documentation is for Thorium admins looking to deploy a new Thorium instance. This guide is just an example and you will need to modify these steps to make them to work in your environment. The instructions described below setup Thorium and it’s dependencies on a blank K8s cluster that is hosted on servers or VMs. It does not use any specific cloud environment, however nothing precludes deployment of Thorium into the cloud.
Prerequisites
You will need to deploy a working K8s cluster on baremetal servers, VMs, or within a hosted cloud environment to start this guide. The K8s cluster will need to have a storage provisioner that can provide persistent volume claims (PVCs) for the database and tracing services that Thorium utilizes. Additionally, admins will need account credentials and permissions to create buckets within an S3-compatible object storage interface that is accessible from the K8s cluster.
Install Infrastructure Components
For cloud deployments, you may skip the setup steps here for any database or other component that your cloud provider supports natively. Instead, you may choose to follow their guides for setup of the equivalent software stack.
Traefik (ingress proxy)
To deploy Traefik as an ingress proxy, follow these installation steps.
Rook (converged storage)
This step is only required if your K8s cluster has attached storage that you wish to use to host S3-compatible and block device storage in a hyperconverged manner.
To deploy Rook, follow these installation steps.
Redis
To deploy Redis, follow these installation steps.
Scylla
To deploy Scylla, follow these installation steps.
Elastic
To deploy Elastic, follow these installation steps.
Tracing (Quickwit and Jaeger)
To deploy Quickwit and Jaeger, follow these installation steps.
Deploy Thorium Operator and Cluster
The finals steps involve deploying the Thorium operator, a ThoriumCluster custom resource, and
Traefik IngressRoutes as described in the Deploy Thorium section.
Traefik
Deploy Traefik
Traefik is a reverse proxy and load balancer that enables routing of http and https traefik to Thorium and any other web services you deploy in K8s (such as a local container registry).
1) Install the latest helm repo for Traefik
helm repo add traefik https://helm.traefik.io/traefik
helm repo update
2) Get a default values file for a Traefik release
helm show values traefik/traefik > traefik-values.yml
3) Modify the default helm values fpr Traefik
Update read and write response timeouts for http and https requests going through the traefik ingress proxy.
ports:
  ...
  web:
    ...
    transport:
      respondingTimeouts:
        readTimeout:   0 # @schema type:[string, integer, 0]
        writeTimeout:  0 # @schema type:[string, integer, 0]
        idleTimeout:   600 # @schema type:[string, integer, 600]
  ...
  ...
  websecure:
    ...
    transport:
      respondingTimeouts:
        readTimeout:   0 # @schema type:[string, integer, 0]
        writeTimeout:  0 # @schema type:[string, integer, 0]
        idleTimeout:   600 # @schema type:[string, integer, 600]
Update the IP addresses for web traffic that will access your Thorium instances from locations external to K8s.
service:
  ...
  externalIPs:
    - 1.2.3.4
    - 1.2.3.5
    - 1.2.3.6
    - 4.3.2.1
Explicitly disable anonymous usage reporting for networked Traefik deployments.
globalArguments:
...
- "--global.sendanonymoususage=false"
4) Create a namespace for Traefik and deploy
kubectl create ns traefik
sleep 5
helm install -f traefik-values.yml traefik traefik/traefik --namespace=traefik
You can update the values of an existing Traefik helm chart with the following command:
helm upgrade -f traefik-values.yml --namespace=traefik traefik traefik/traefik
5) Verify the Traefik pod started
kubectl get pods -n traefik
# NAME                       READY   STATUS    RESTARTS   AGE
# traefik-HASH               1/1     Running   0          1h
Rook
Deploy Rook
This section will describe how to deploy a Rook Ceph cluster on K8s. This deployment will assume the K8s cluster member nodes have attached unprovisioned raw storage devices. If you want to use host storage from an existing mounted filesystem, review the rook docs before proceeding.
For single server Thorium deployments its best to skip deploying rook and just use a host path storageClass provisioner and Minio for better performance.
1) Create Rook CRD:
Apply the rook CRD and common resources.
kubectl apply -f https://raw.githubusercontent.com/rook/rook/refs/tags/v1.16.4/deploy/examples/crds.yaml
kubectl apply -f https://raw.githubusercontent.com/rook/rook/refs/tags/v1.16.4/deploy/examples/common.yaml
2) Create the Rook operator
You can deploy Rook Ceph with the default operator options. However, you may choose to disable certain drivers such as CephFS that won’t be needed for Thorium. To do that download the operator YAML resource definition and modify it before applying it.
kubectl apply -f https://github.com/rook/rook/refs/tags/v1.16.4/deploy/examples/operator.yaml
3) Create Ceph/S3 Object Store
Create the Ceph pools and RADOS Object Gateway (RGW) instance(s). You may want to modify the redundancy factors and number of gateway instances depending on the size of your K8s cluster. Some fields you may look to modify are:
The totals of
dataChunks+codingChunksand separatelysizemust both be <= the number of k8s cluster servers with attached storage that Rook can utilize. If this condition is not met, the Ceph cluster Rook deploys will not be in a healthy state after deployment and the Rook operator may fail to complete the deployment process.
spec.metadataPool.replicated.size- Set to less than 3 for small k8s clustersspec.dataPool.erasureCoded.dataChunks- More erasure coding data chunks for better storage efficiency, but lower write performancespec.dataPool.erasureCoded.codingChunks- More erasure coding chunks for extra data redundancyspec.gateway.instances- Increase number of RGW pods for larger K8s clusters and better performance
cat <<EOF | kubectl apply -f -
#################################################################################################################
# Create an object store with settings for erasure coding for the data pool. A minimum of 3 nodes with OSDs are
# required in this example since failureDomain is host.
#  kubectl create -f object-ec.yaml
#################################################################################################################

apiVersion: ceph.rook.io/v1
kind: CephObjectStore
metadata:
  name: thorium-s3-store
  namespace: rook-ceph # namespace:cluster
spec:
  # The pool spec used to create the metadata pools. Must use replication.
  metadataPool:
    failureDomain: osd # host
    replicated:
      size: 3
      # Disallow setting pool with replica 1, this could lead to data loss without recovery.
      # Make sure you're *ABSOLUTELY CERTAIN* that is what you want
      requireSafeReplicaSize: true
    parameters:
      # Inline compression mode for the data pool
      # Further reference: https://docs.ceph.com/docs/master/rados/configuration/bluestore-config-ref/#inline-compression
      compression_mode: none
      # gives a hint (%) to Ceph in terms of expected consumption of the total cluster capacity of a given pool
      # for more info: https://docs.ceph.com/docs/master/rados/operations/placement-groups/#specifying-expected-pool-size
      #target_size_ratio: ".5"
  # The pool spec used to create the data pool. Can use replication or erasure coding.
  dataPool:
    failureDomain: osd # host
    erasureCoded:
      dataChunks:  3
      codingChunks:  2
    parameters:
      # Inline compression mode for the data pool
      # Further reference: https://docs.ceph.com/docs/master/rados/configuration/bluestore-config-ref/#inline-compression
      compression_mode: none
      # gives a hint (%) to Ceph in terms of expected consumption of the total cluster capacity of a given pool
      # for more info: https://docs.ceph.com/docs/master/rados/operations/placement-groups/#specifying-expected-pool-size
      #target_size_ratio: ".5"
  # Whether to preserve metadata and data pools on object store deletion
  preservePoolsOnDelete: true
  # The gateway service configuration
  gateway:
    # A reference to the secret in the rook namespace where the ssl certificate is stored
    sslCertificateRef:
    # The port that RGW pods will listen on (http)
    port: 80
    # The port that RGW pods will listen on (https). An ssl certificate is required.
    # securePort: 443
    # The number of pods in the rgw deployment
    instances: 1 # 3
    # The affinity rules to apply to the rgw deployment or daemonset.
    placement:
    #  nodeAffinity:
    #    requiredDuringSchedulingIgnoredDuringExecution:
    #      nodeSelectorTerms:
    #      - matchExpressions:
    #        - key: role
    #          operator: In
    #          values:
    #          - rgw-node
    #  tolerations:
    #  - key: rgw-node
    #    operator: Exists
    #  podAffinity:
    #  podAntiAffinity:
    # A key/value list of annotations
    annotations:
    #  key: value
    # A key/value list of labels
    labels:
    #  key: value
    resources:
    # The requests and limits set here, allow the object store gateway Pod(s) to use half of one CPU core and 1 gigabyte of memory
    #  limits:
    #    cpu: "500m"
    #    memory: "1024Mi"
    #  requests:
    #    cpu: "500m"
    #    memory: "1024Mi"
    # priorityClassName: my-priority-class
  #zone:
  #name: zone-a
  # service endpoint healthcheck
  healthCheck:
    # Configure the pod probes for the rgw daemon
    startupProbe:
      disabled: false
    readinessProbe:
      disabled: false
EOF
4) Create block storage class
Use the following storage class to create a Rook Ceph data pool to store RADOS block devices (RBDs)
that will map to Kubernetes persistent volumes. The following command will create a block device pool
and storageClass (called rook-ceph-block). You will use this storage class name for creating PVCs
in the sections that follow. You may want to update the replication factors depending on the size
of your k8s cluster.
spec.replicated.size- Set to less than 3 for small k8s clustersspec.erasureCoded.dataChunks- More erasure coding data chunks for better storage efficiency, but lower write performancespec.erasureCoded.codingChunks- More erasure coding chunks for extra data redundancy
cat <<EOF | kubectl apply -f -
#################################################################################################################
# Create a storage class with a data pool that uses erasure coding for a production environment.
# A metadata pool is created with replication enabled. A minimum of 3 nodes with OSDs are required in this
# example since the default failureDomain is host.
#  kubectl create -f storageclass-ec.yaml
#################################################################################################################

apiVersion: ceph.rook.io/v1
kind: CephBlockPool
metadata:
  name: replicated-metadata-pool
  namespace: rook-ceph # namespace:cluster
spec:
  failureDomain: osd # host
  replicated:
    size: 3
---
apiVersion: ceph.rook.io/v1
kind: CephBlockPool
metadata:
  name: ec-data-pool
  namespace: rook-ceph # namespace:cluster
spec:
  failureDomain: osd # host
  # Make sure you have enough nodes and OSDs running bluestore to support the replica size or erasure code chunks.
  # For the below settings, you need at least 3 OSDs on different nodes (because the `failureDomain` is `host` by default).
  erasureCoded:
    dataChunks: 3
    codingChunks: 2
---
apiVersion: storage.k8s.io/v1
kind: StorageClass
metadata:
  name: rook-ceph-block
# Change "rook-ceph" provisioner prefix to match the operator namespace if needed
provisioner: rook-ceph.rbd.csi.ceph.com # driver:namespace:operator
parameters:
  # clusterID is the namespace where the rook cluster is running
  # If you change this namespace, also change the namespace below where the secret namespaces are defined
  clusterID: rook-ceph # namespace:cluster

  # If you want to use erasure coded pool with RBD, you need to create
  # two pools. one erasure coded and one replicated.
  # You need to specify the replicated pool here in the `pool` parameter, it is
  # used for the metadata of the images.
  # The erasure coded pool must be set as the `dataPool` parameter below.
  dataPool: ec-data-pool
  pool: replicated-metadata-pool

  # (optional) mapOptions is a comma-separated list of map options.
  # For krbd options refer
  # https://docs.ceph.com/docs/master/man/8/rbd/#kernel-rbd-krbd-options
  # For nbd options refer
  # https://docs.ceph.com/docs/master/man/8/rbd-nbd/#options
  # mapOptions: lock_on_read,queue_depth=1024

  # (optional) unmapOptions is a comma-separated list of unmap options.
  # For krbd options refer
  # https://docs.ceph.com/docs/master/man/8/rbd/#kernel-rbd-krbd-options
  # For nbd options refer
  # https://docs.ceph.com/docs/master/man/8/rbd-nbd/#options
  # unmapOptions: force

  # RBD image format. Defaults to "2".
  imageFormat: "2"

  # RBD image features. Available for imageFormat: "2". CSI RBD currently supports only `layering` feature.
  imageFeatures: layering

  # The secrets contain Ceph admin credentials. These are generated automatically by the operator
  # in the same namespace as the cluster.
  csi.storage.k8s.io/provisioner-secret-name: rook-csi-rbd-provisioner
  csi.storage.k8s.io/provisioner-secret-namespace: rook-ceph # namespace:cluster
  csi.storage.k8s.io/controller-expand-secret-name: rook-csi-rbd-provisioner
  csi.storage.k8s.io/controller-expand-secret-namespace: rook-ceph # namespace:cluster
  csi.storage.k8s.io/node-stage-secret-name: rook-csi-rbd-node
  csi.storage.k8s.io/node-stage-secret-namespace: rook-ceph # namespace:cluster
  # Specify the filesystem type of the volume. If not specified, csi-provisioner
  # will set default as `ext4`.
  csi.storage.k8s.io/fstype: xfs
# uncomment the following to use rbd-nbd as mounter on supported nodes
# **IMPORTANT**: CephCSI v3.4.0 onwards a volume healer functionality is added to reattach
# the PVC to application pod if nodeplugin pod restart.
# Its still in Alpha support. Therefore, this option is not recommended for production use.
#mounter: rbd-nbd
allowVolumeExpansion: true
reclaimPolicy: Delete
EOF
6) Create a Thorium S3 User
Create a Thorium S3 user and save access/secret key that are generated with the following command.
kubectl -n rook-ceph exec -it deploy/rook-ceph-tools -- radosgw-admin user create --uid=thorium-s3-user --display-name="Thorium S3 User"
7) Deploy Rook Ceph Toolbox pod
kubectl https://raw.githubusercontent.com/rook/rook/refs/heads/master/deploy/examples/toolbox.yaml
8) Verify Rook pods are all running
kubectl get pods -n rook-ceph
For a 5 node k8s cluster with 2 raw storage devices per node, the output might look like this:
csi-rbdplugin-provisioner-HASH                       5/5     Running     0             1h
csi-rbdplugin-provisioner-HASH                       5/5     Running     0             1h
csi-rbdplugin-HASH                                   3/3     Running     0             1h
csi-rbdplugin-HASH                                   3/3     Running     0             1h
csi-rbdplugin-HASH                                   3/3     Running     0             1h
csi-rbdplugin-HASH                                   3/3     Running     0             1h
csi-rbdplugin-HASH                                   3/3     Running     0             1h
rook-ceph-crashcollector-NODE1-HASH                  1/1     Running     0             1h
rook-ceph-crashcollector-NODE2-HASH                  1/1     Running     0             1h
rook-ceph-crashcollector-NODE3-HASH                  1/1     Running     0             1h
rook-ceph-crashcollector-NODE4-HASH                  1/1     Running     0             1h
rook-ceph-crashcollector-NODE5-HASH                  1/1     Running     0             1h
rook-ceph-exporter-NODE5-HASH                        1/1     Running     0             1h
rook-ceph-exporter-NODE5-HASH                        1/1     Running     0             1h
rook-ceph-exporter-NODE5-HASH                        1/1     Running     0             1h
rook-ceph-exporter-NODE5-HASH                        1/1     Running     0             1h
rook-ceph-exporter-NODE5-HASH                        1/1     Running     0             1h
rook-ceph-mgr-a-HASH                                 3/3     Running     0             1h
rook-ceph-mgr-b-HASH                                 3/3     Running     0             1h
rook-ceph-mon-a-HASH                                 2/2     Running     0             1h
rook-ceph-mon-b-HASH                                 2/2     Running     0             1h
rook-ceph-mon-c-HASH                                 2/2     Running     0             1h
rook-ceph-operator-HASH                              1/1     Running     0             1h
rook-ceph-osd-0-HASH                                 2/2     Running     0             1h
rook-ceph-osd-1-HASH                                 2/2     Running     0             1h
rook-ceph-osd-3-HASH                                 2/2     Running     0             1h
rook-ceph-osd-4-HASH                                 2/2     Running     0             1h
rook-ceph-osd-5-HASH                                 2/2     Running     0             1h
rook-ceph-osd-6-HASH                                 2/2     Running     0             1h
rook-ceph-osd-7-HASH                                 2/2     Running     0             1h
rook-ceph-osd-8-HASH                                 2/2     Running     0             1h
rook-ceph-osd-9-HASH                                 2/2     Running     0             1h
rook-ceph-osd-prepare-NODE5-HASH                     0/1     Completed   0             1h
rook-ceph-osd-prepare-NODE5-HASH                     0/1     Completed   0             1h
rook-ceph-osd-prepare-NODE5-HASH                     0/1     Completed   0             1h
rook-ceph-osd-prepare-NODE5-HASH                     0/1     Completed   0             1h
rook-ceph-osd-prepare-NODE5-HASH                     0/1     Completed   0             1h
rook-ceph-rgw-thorium-s3-store-a-HASH                2/2     Running     0             1h
rook-ceph-tools-HASH                                 1/1     Running     0             1h
9) Verify Ceph cluster is healthy
If the Rook Ceph cluster is healthy, you should be able to run a status command from the Rook
toolbox. The health section of the cluster status will show HEALTH_OK. If you see HEALTH_WARN
you will need to look at the reasons at the bottom of the cluster status to troubleshoot the
cause.
kubectl -n rook-ceph exec -it deploy/rook-ceph-tools -- ceph -s
  cluster:
    id:     20ea7cb0-5cab-4565-bc1c-360b6cd1282b
    health: HEALTH_OK

  services:
    mon: 3 daemons, quorum a,b,c (age 1h)
    mgr: b(active, since 1h), standbys: a
    osd: 10 osds: 10 up (since 1h), 10 in (since 1h)
    rgw: 1 daemon active (1 hosts, 1 zones)

  data:
...
    ```
Redis
Deploy Redis DB
1) Create a redis.conf secret and update the default password
Create a redis.conf file that will configure your Redis DB password and other settings. A complete example of the config is also included in the appendices at the end of this section.
vi redis.conf
Change the default password on the requirepass config line.
The password set here will be added to the thorium-cluster.yml CRD file later in this guide.
redis.conf:
# IMPORTANT NOTE: starting with Redis 6 "requirepass" is just a compatibility
# layer on top of the new ACL system. The option effect will be just setting
# the password for the default user. Clients will still authenticate using
# AUTH <password> as usually, or more explicitly with AUTH default <password>
# if they follow the new protocol: both will work.
#
requirepass <PASSWORD>
Now create the redis namespace and config secret using kubectl.
kubectl create ns redis
kubectl create secret generic -n redis conf --from-file=./redis.conf
2) Create the Redis persistent storage volume
Create a K8s PVC for holding Redis’s persistent snapshot storage. Different K8s deployments may use
different storageClass (provisioner) names. Update the storageClassName field before creating
the PVC from the following spec. Admins may also choose to change the size of the PVC depending on the
expected size of the Thorium deployment.
Many of the kubectl commands and configs in these docs may be edited on the page before being copied.
cat <<EOF | kubectl apply -f -
apiVersion: v1
kind: PersistentVolumeClaim
metadata:
  name: redis-persistent-storage-claim
  namespace: redis
spec:
  storageClassName: csi-rbd-sc
  resources:
    requests:
      storage: 1024Gi
  accessModes:
  - ReadWriteOnce
EOF
3) Create Redis Statefulset
Redis will be deployed to a single pod using a K8s StatefulSet. The resource requests and Redis version
may need to be adjusted for different environments or Thorium versions.
cat <<EOF | kubectl apply -f -
apiVersion: apps/v1
kind: StatefulSet
metadata:
  name: redis
  namespace: redis
  labels:
    app: redis
spec:
  serviceName: redis
  replicas: 1
  selector:
    matchLabels:
      app: redis
  template:
    metadata:
      labels:
          app: redis
    spec:
      containers:
        - name: redis
          image: docker.io/redis:7
          imagePullPolicy: Always
          command: ["redis-server", "/var/lib/redis/redis.conf"]
          resources:
            requests:
              memory: "256Gi"
              cpu: "2"
          volumeMounts:
            - mountPath: "/data"
              name: redis-data
            - mountPath: "/var/lib/redis/"
              name: redis-conf
      volumes:
        - name: redis-conf
          secret:
            secretName: conf
        - name: redis-data
          persistentVolumeClaim:
            claimName: redis-persistent-storage-claim
EOF
4) Create Redis Service
cat <<EOF | kubectl apply -f -
apiVersion: v1
kind: Service
metadata:
  name: redis
  namespace: redis
spec:
  type: ClusterIP
  selector:
    app: redis
  ports:
  - name: redis
    port: 6379
    targetPort: 6379
EOF
5) Verify Redis is running
kubectl get pods -n redis
There should be a single running Redis pod if the setup process was successful:
NAME      READY   STATUS    RESTARTS   AGE
redis-0   1/1     Running   0          1m
Appendices
Example redis.conf (with default insecure password):
# Redis configuration file example.
#
# Note that in order to read the configuration file, Redis must be
# started with the file path as first argument:
#
# ./redis-server /path/to/redis.conf

# Note on units: when memory size is needed, it is possible to specify
# it in the usual form of 1k 5GB 4M and so forth:
#
# 1k => 1000 bytes
# 1kb => 1024 bytes
# 1m => 1000000 bytes
# 1mb => 1024*1024 bytes
# 1g => 1000000000 bytes
# 1gb => 1024*1024*1024 bytes
#
# units are case insensitive so 1GB 1Gb 1gB are all the same.

################################## INCLUDES ###################################

# Include one or more other config files here.  This is useful if you
# have a standard template that goes to all Redis servers but also need
# to customize a few per-server settings.  Include files can include
# other files, so use this wisely.
#
# Note that option "include" won't be rewritten by command "CONFIG REWRITE"
# from admin or Redis Sentinel. Since Redis always uses the last processed
# line as value of a configuration directive, you'd better put includes
# at the beginning of this file to avoid overwriting config change at runtime.
#
# If instead you are interested in using includes to override configuration
# options, it is better to use include as the last line.
#
# include /path/to/local.conf
# include /path/to/other.conf

################################## MODULES #####################################

# Load modules at startup. If the server is not able to load modules
# it will abort. It is possible to use multiple loadmodule directives.
#
# loadmodule /path/to/my_module.so
# loadmodule /path/to/other_module.so

################################## NETWORK #####################################

# By default, if no "bind" configuration directive is specified, Redis listens
# for connections from all available network interfaces on the host machine.
# It is possible to listen to just one or multiple selected interfaces using
# the "bind" configuration directive, followed by one or more IP addresses.
#
# Examples:
#
# bind 192.168.1.101.00.0.0.1
# bind 127.0.0.1 ::1
#
# ~~~ WARNING ~~~ If the computer running Redis is directly exposed to the
# internet, binding to all the interfaces is dangerous and will expose the
# instance to everybody on the internet. So by default we uncomment the
# following bind directive, that will force Redis to listen only on the
# IPv4 loopback interface address (this means Redis will only be able to
# accept client connections from the same host that it is running on).
#
# IF YOU ARE SURE YOU WANT YOUR INSTANCE TO LISTEN TO ALL THE INTERFACES
# JUST COMMENT OUT THE FOLLOWING LINE.
# ~~~~~~~~~~~~~~~~~~~~~~~~~~~~~~~~~~~~~~~~~~~~~~~~~~~~~~~~~~~~~~~~~~~~~~~~
bind 0.0.0.0

# Protected mode is a layer of security protection, in order to avoid that
# Redis instances left open on the internet are accessed and exploited.
#
# When protected mode is on and if:
#
# 1) The server is not binding explicitly to a set of addresses using the
#    "bind" directive.
# 2) No password is configured.
#
# The server only accepts connections from clients connecting from the
# IPv4 and IPv6 loopback addresses 127.0.0.1 and ::1, and from Unix domain
# sockets.
#
# By default protected mode is enabled. You should disable it only if
# you are sure you want clients from other hosts to connect to Redis
# even if no authentication is configured, nor a specific set of interfaces
# are explicitly listed using the "bind" directive.
protected-mode yes

# Accept connections on the specified port, default is 6379 (IANA #815344).
# If port 0 is specified Redis will not listen on a TCP socket.
port 6379

# TCP listen() backlog.
#
# In high requests-per-second environments you need a high backlog in order
# to avoid slow clients connection issues. Note that the Linux kernel
# will silently truncate it to the value of /proc/sys/net/core/somaxconn so
# make sure to raise both the value of somaxconn and tcp_max_syn_backlog
# in order to get the desired effect.
tcp-backlog 511

# Unix socket.
#
# Specify the path for the Unix socket that will be used to listen for
# incoming connections. There is no default, so Redis will not listen
# on a unix socket when not specified.
#
# unixsocket /tmp/redis.sock
# unixsocketperm 700

# Close the connection after a client is idle for N seconds (0 to disable)
timeout 0

# TCP keepalive.
#
# If non-zero, use SO_KEEPALIVE to send TCP ACKs to clients in absence
# of communication. This is useful for two reasons:
#
# 1) Detect dead peers.
# 2) Force network equipment in the middle to consider the connection to be
#    alive.
#
# On Linux, the specified value (in seconds) is the period used to send ACKs.
# Note that to close the connection the double of the time is needed.
# On other kernels the period depends on the kernel configuration.
#
# A reasonable value for this option is 300 seconds, which is the new
# Redis default starting with Redis 3.2.1.
tcp-keepalive 300

################################# TLS/SSL #####################################

# By default, TLS/SSL is disabled. To enable it, the "tls-port" configuration
# directive can be used to define TLS-listening ports. To enable TLS on the
# default port, use:
#
# port 0
# tls-port 6379

# Configure a X.509 certificate and private key to use for authenticating the
# server to connected clients, masters or cluster peers.  These files should be
# PEM formatted.
#
# tls-cert-file redis.crt
# tls-key-file redis.key

# Configure a DH parameters file to enable Diffie-Hellman (DH) key exchange:
#
# tls-dh-params-file redis.dh

# Configure a CA certificate(s) bundle or directory to authenticate TLS/SSL
# clients and peers.  Redis requires an explicit configuration of at least one
# of these, and will not implicitly use the system wide configuration.
#
# tls-ca-cert-file ca.crt
# tls-ca-cert-dir /etc/ssl/certs

# By default, clients (including replica servers) on a TLS port are required
# to authenticate using valid client side certificates.
#
# If "no" is specified, client certificates are not required and not accepted.
# If "optional" is specified, client certificates are accepted and must be
# valid if provided, but are not required.
#
# tls-auth-clients no
# tls-auth-clients optional

# By default, a Redis replica does not attempt to establish a TLS connection
# with its master.
#
# Use the following directive to enable TLS on replication links.
#
# tls-replication yes

# By default, the Redis Cluster bus uses a plain TCP connection. To enable
# TLS for the bus protocol, use the following directive:
#
# tls-cluster yes

# Explicitly specify TLS versions to support. Allowed values are case insensitive
# and include "TLSv1", "TLSv1.1", "TLSv1.2", "TLSv1.3" (OpenSSL >= 1.1.1) or
# any combination. To enable only TLSv1.2 and TLSv1.3, use:
#
# tls-protocols "TLSv1.2 TLSv1.3"

# Configure allowed ciphers.  See the ciphers(1ssl) manpage for more information
# about the syntax of this string.
#
# Note: this configuration applies only to <= TLSv1.2.
#
# tls-ciphers DEFAULT:!MEDIUM

# Configure allowed TLSv1.3 ciphersuites.  See the ciphers(1ssl) manpage for more
# information about the syntax of this string, and specifically for TLSv1.3
# ciphersuites.
#
# tls-ciphersuites TLS_CHACHA20_POLY1305_SHA256

# When choosing a cipher, use the server's preference instead of the client
# preference. By default, the server follows the client's preference.
#
# tls-prefer-server-ciphers yes

# By default, TLS session caching is enabled to allow faster and less expensive
# reconnections by clients that support it. Use the following directive to disable
# caching.
#
# tls-session-caching no

# Change the default number of TLS sessions cached. A zero value sets the cache
# to unlimited size. The default size is 20480.
#
# tls-session-cache-size 5000

# Change the default timeout of cached TLS sessions. The default timeout is 300
# seconds.
#
# tls-session-cache-timeout 60

################################# GENERAL #####################################

# By default Redis does not run as a daemon. Use 'yes' if you need it.
# Note that Redis will write a pid file in /var/run/redis.pid when daemonized.
daemonize no

# If you run Redis from upstart or systemd, Redis can interact with your
# supervision tree. Options:
#   supervised no      - no supervision interaction
#   supervised upstart - signal upstart by putting Redis into SIGSTOP mode
#                        requires "expect stop" in your upstart job config
#   supervised systemd - signal systemd by writing READY=1 to $NOTIFY_SOCKET
#   supervised auto    - detect upstart or systemd method based on
#                        UPSTART_JOB or NOTIFY_SOCKET environment variables
# Note: these supervision methods only signal "process is ready."
#       They do not enable continuous pings back to your supervisor.
supervised no

# If a pid file is specified, Redis writes it where specified at startup
# and removes it at exit.
#
# When the server runs non daemonized, no pid file is created if none is
# specified in the configuration. When the server is daemonized, the pid file
# is used even if not specified, defaulting to "/var/run/redis.pid".
#
# Creating a pid file is best effort: if Redis is not able to create it
# nothing bad happens, the server will start and run normally.
pidfile /var/run/redis_6379.pid

# Specify the server verbosity level.
# This can be one of:
# debug (a lot of information, useful for development/testing)
# verbose (many rarely useful info, but not a mess like the debug level)
# notice (moderately verbose, what you want in production probably)
# warning (only very important / critical messages are logged)
loglevel notice

# Specify the log file name. Also the empty string can be used to force
# Redis to log on the standard output. Note that if you use standard
# output for logging but daemonize, logs will be sent to /dev/null
logfile ""

# To enable logging to the system logger, just set 'syslog-enabled' to yes,
# and optionally update the other syslog parameters to suit your needs.
# syslog-enabled no

# Specify the syslog identity.
# syslog-ident redis

# Specify the syslog facility. Must be USER or between LOCAL0-LOCAL7.
# syslog-facility local0

# Set the number of databases. The default database is DB 0, you can select
# a different one on a per-connection basis using SELECT <dbid> where
# dbid is a number between 0 and 'databases'-1
databases 16

# By default Redis shows an ASCII art logo only when started to log to the
# standard output and if the standard output is a TTY. Basically this means
# that normally a logo is displayed only in interactive sessions.
#
# However it is possible to force the pre-4.0 behavior and always show a
# ASCII art logo in startup logs by setting the following option to yes.
always-show-logo yes

################################ SNAPSHOTTING  ################################
#
# Save the DB on disk:
#
#   save <seconds> <changes>
#
#   Will save the DB if both the given number of seconds and the given
#   number of write operations against the DB occurred.
#
#   In the example below the behavior will be to save:
#   after 900 sec (15 min) if at least 1 key changed
#   after 300 sec (5 min) if at least 10 keys changed
#   after 60 sec if at least 10000 keys changed
#
#   Note: you can disable saving completely by commenting out all "save" lines.
#
#   It is also possible to remove all the previously configured save
#   points by adding a save directive with a single empty string argument
#   like in the following example:
#
#   save ""

save 900 1
save 300 10
save 60 10000

# By default Redis will stop accepting writes if RDB snapshots are enabled
# (at least one save point) and the latest background save failed.
# This will make the user aware (in a hard way) that data is not persisting
# on disk properly, otherwise chances are that no one will notice and some
# disaster will happen.
#
# If the background saving process will start working again Redis will
# automatically allow writes again.
#
# However if you have setup your proper monitoring of the Redis server
# and persistence, you may want to disable this feature so that Redis will
# continue to work as usual even if there are problems with disk,
# permissions, and so forth.
stop-writes-on-bgsave-error yes

# Compress string objects using LZF when dump .rdb databases?
# By default compression is enabled as it's almost always a win.
# If you want to save some CPU in the saving child set it to 'no' but
# the dataset will likely be bigger if you have compressible values or keys.
rdbcompression yes

# Since version 5 of RDB a CRC64 checksum is placed at the end of the file.
# This makes the format more resistant to corruption but there is a performance
# hit to pay (around 10%) when saving and loading RDB files, so you can disable it
# for maximum performances.
#
# RDB files created with checksum disabled have a checksum of zero that will
# tell the loading code to skip the check.
rdbchecksum yes

# The filename where to dump the DB
dbfilename dump2.rdb

# Remove RDB files used by replication in instances without persistence
# enabled. By default this option is disabled, however there are environments
# where for regulations or other security concerns, RDB files persisted on
# disk by masters in order to feed replicas, or stored on disk by replicas
# in order to load them for the initial synchronization, should be deleted
# ASAP. Note that this option ONLY WORKS in instances that have both AOF
# and RDB persistence disabled, otherwise is completely ignored.
#
# An alternative (and sometimes better) way to obtain the same effect is
# to use diskless replication on both master and replicas instances. However
# in the case of replicas, diskless is not always an option.
rdb-del-sync-files no

# The working directory.
#
# The DB will be written inside this directory, with the filename specified
# above using the 'dbfilename' configuration directive.
#
# The Append Only File will also be created inside this directory.
#
# Note that you must specify a directory here, not a file name.
dir /data

################################# REPLICATION #################################

# Master-Replica replication. Use replicaof to make a Redis instance a copy of
# another Redis server. A few things to understand ASAP about Redis replication.
#
#   +------------------+      +---------------+
#   |      Master      | ---> |    Replica    |
#   | (receive writes) |      |  (exact copy) |
#   +------------------+      +---------------+
#
# 1) Redis replication is asynchronous, but you can configure a master to
#    stop accepting writes if it appears to be not connected with at least
#    a given number of replicas.
# 2) Redis replicas are able to perform a partial resynchronization with the
#    master if the replication link is lost for a relatively small amount of
#    time. You may want to configure the replication backlog size (see the next
#    sections of this file) with a sensible value depending on your needs.
# 3) Replication is automatic and does not need user intervention. After a
#    network partition replicas automatically try to reconnect to masters
#    and resynchronize with them.
#
# replicaof <masterip> <masterport>

# If the master is password protected (using the "requirepass" configuration
# directive below) it is possible to tell the replica to authenticate before
# starting the replication synchronization process, otherwise the master will
# refuse the replica request.
#
# masterauth <master-password>
#
# However this is not enough if you are using Redis ACLs (for Redis version
# 6 or greater), and the default user is not capable of running the PSYNC
# command and/or other commands needed for replication. In this case it's
# better to configure a special user to use with replication, and specify the
# masteruser configuration as such:
#
# masteruser <username>
#
# When masteruser is specified, the replica will authenticate against its
# master using the new AUTH form: AUTH <username> <password>.

# When a replica loses its connection with the master, or when the replication
# is still in progress, the replica can act in two different ways:
#
# 1) if replica-serve-stale-data is set to 'yes' (the default) the replica will
#    still reply to client requests, possibly with out of date data, or the
#    data set may just be empty if this is the first synchronization.
#
# 2) If replica-serve-stale-data is set to 'no' the replica will reply with
#    an error "SYNC with master in progress" to all commands except:
#    INFO, REPLICAOF, AUTH, PING, SHUTDOWN, REPLCONF, ROLE, CONFIG, SUBSCRIBE,
#    UNSUBSCRIBE, PSUBSCRIBE, PUNSUBSCRIBE, PUBLISH, PUBSUB, COMMAND, POST,
#    HOST and LATENCY.
#
replica-serve-stale-data yes

# You can configure a replica instance to accept writes or not. Writing against
# a replica instance may be useful to store some ephemeral data (because data
# written on a replica will be easily deleted after resync with the master) but
# may also cause problems if clients are writing to it because of a
# misconfiguration.
#
# Since Redis 2.6 by default replicas are read-only.
#
# Note: read only replicas are not designed to be exposed to untrusted clients
# on the internet. It's just a protection layer against misuse of the instance.
# Still a read only replica exports by default all the administrative commands
# such as CONFIG, DEBUG, and so forth. To a limited extent you can improve
# security of read only replicas using 'rename-command' to shadow all the
# administrative / dangerous commands.
replica-read-only yes

# Replication SYNC strategy: disk or socket.
#
# New replicas and reconnecting replicas that are not able to continue the
# replication process just receiving differences, need to do what is called a
# "full synchronization". An RDB file is transmitted from the master to the
# replicas.
#
# The transmission can happen in two different ways:
#
# 1) Disk-backed: The Redis master creates a new process that writes the RDB
#                 file on disk. Later the file is transferred by the parent
#                 process to the replicas incrementally.
# 2) Diskless: The Redis master creates a new process that directly writes the
#              RDB file to replica sockets, without touching the disk at all.
#
# With disk-backed replication, while the RDB file is generated, more replicas
# can be queued and served with the RDB file as soon as the current child
# producing the RDB file finishes its work. With diskless replication instead
# once the transfer starts, new replicas arriving will be queued and a new
# transfer will start when the current one terminates.
#
# When diskless replication is used, the master waits a configurable amount of
# time (in seconds) before starting the transfer in the hope that multiple
# replicas will arrive and the transfer can be parallelized.
#
# With slow disks and fast (large bandwidth) networks, diskless replication
# works better.
repl-diskless-sync no

# When diskless replication is enabled, it is possible to configure the delay
# the server waits in order to spawn the child that transfers the RDB via socket
# to the replicas.
#
# This is important since once the transfer starts, it is not possible to serve
# new replicas arriving, that will be queued for the next RDB transfer, so the
# server waits a delay in order to let more replicas arrive.
#
# The delay is specified in seconds, and by default is 5 seconds. To disable
# it entirely just set it to 0 seconds and the transfer will start ASAP.
repl-diskless-sync-delay 5

# -----------------------------------------------------------------------------
# WARNING: RDB diskless load is experimental. Since in this setup the replica
# does not immediately store an RDB on disk, it may cause data loss during
# failovers. RDB diskless load + Redis modules not handling I/O reads may also
# cause Redis to abort in case of I/O errors during the initial synchronization
# stage with the master. Use only if your do what you are doing.
# -----------------------------------------------------------------------------
#
# Replica can load the RDB it reads from the replication link directly from the
# socket, or store the RDB to a file and read that file after it was completely
# received from the master.
#
# In many cases the disk is slower than the network, and storing and loading
# the RDB file may increase replication time (and even increase the master's
# Copy on Write memory and salve buffers).
# However, parsing the RDB file directly from the socket may mean that we have
# to flush the contents of the current database before the full rdb was
# received. For this reason we have the following options:
#
# "disabled"    - Don't use diskless load (store the rdb file to the disk first)
# "on-empty-db" - Use diskless load only when it is completely safe.
# "swapdb"      - Keep a copy of the current db contents in RAM while parsing
#                 the data directly from the socket. note that this requires
#                 sufficient memory, if you don't have it, you risk an OOM kill.
repl-diskless-load disabled

# Replicas send PINGs to server in a predefined interval. It's possible to
# change this interval with the repl_ping_replica_period option. The default
# value is 10 seconds.
#
# repl-ping-replica-period 10

# The following option sets the replication timeout for:
#
# 1) Bulk transfer I/O during SYNC, from the point of view of replica.
# 2) Master timeout from the point of view of replicas (data, pings).
# 3) Replica timeout from the point of view of masters (REPLCONF ACK pings).
#
# It is important to make sure that this value is greater than the value
# specified for repl-ping-replica-period otherwise a timeout will be detected
# every time there is low traffic between the master and the replica. The default
# value is 60 seconds.
#
# repl-timeout 60

# Disable TCP_NODELAY on the replica socket after SYNC?
#
# If you select "yes" Redis will use a smaller number of TCP packets and
# less bandwidth to send data to replicas. But this can add a delay for
# the data to appear on the replica side, up to 40 milliseconds with
# Linux kernels using a default configuration.
#
# If you select "no" the delay for data to appear on the replica side will
# be reduced but more bandwidth will be used for replication.
#
# By default we optimize for low latency, but in very high traffic conditions
# or when the master and replicas are many hops away, turning this to "yes" may
# be a good idea.
repl-disable-tcp-nodelay no

# Set the replication backlog size. The backlog is a buffer that accumulates
# replica data when replicas are disconnected for some time, so that when a
# replica wants to reconnect again, often a full resync is not needed, but a
# partial resync is enough, just passing the portion of data the replica
# missed while disconnected.
#
# The bigger the replication backlog, the longer the replica can endure the
# disconnect and later be able to perform a partial resynchronization.
#
# The backlog is only allocated if there is at least one replica connected.
#
# repl-backlog-size 1mb

# After a master has no connected replicas for some time, the backlog will be
# freed. The following option configures the amount of seconds that need to
# elapse, starting from the time the last replica disconnected, for the backlog
# buffer to be freed.
#
# Note that replicas never free the backlog for timeout, since they may be
# promoted to masters later, and should be able to correctly "partially
# resynchronize" with other replicas: hence they should always accumulate backlog.
#
# A value of 0 means to never release the backlog.
#
# repl-backlog-ttl 3600

# The replica priority is an integer number published by Redis in the INFO
# output. It is used by Redis Sentinel in order to select a replica to promote
# into a master if the master is no longer working correctly.
#
# A replica with a low priority number is considered better for promotion, so
# for instance if there are three replicas with priority 10, 100, 25 Sentinel
# will pick the one with priority 10, that is the lowest.
#
# However a special priority of 0 marks the replica as not able to perform the
# role of master, so a replica with priority of 0 will never be selected by
# Redis Sentinel for promotion.
#
# By default the priority is 100.
replica-priority 100

# It is possible for a master to stop accepting writes if there are less than
# N replicas connected, having a lag less or equal than M seconds.
#
# The N replicas need to be in "online" state.
#
# The lag in seconds, that must be <= the specified value, is calculated from
# the last ping received from the replica, that is usually sent every second.
#
# This option does not GUARANTEE that N replicas will accept the write, but
# will limit the window of exposure for lost writes in case not enough replicas
# are available, to the specified number of seconds.
#
# For example to require at least 3 replicas with a lag <= 10 seconds use:
#
# min-replicas-to-write 3
# min-replicas-max-lag 10
#
# Setting one or the other to 0 disables the feature.
#
# By default min-replicas-to-write is set to 0 (feature disabled) and
# min-replicas-max-lag is set to 10.

# A Redis master is able to list the address and port of the attached
# replicas in different ways. For example the "INFO replication" section
# offers this information, which is used, among other tools, by
# Redis Sentinel in order to discover replica instances.
# Another place where this info is available is in the output of the
# "ROLE" command of a master.
#
# The listed IP address and port normally reported by a replica is
# obtained in the following way:
#
#   IP: The address is auto detected by checking the peer address
#   of the socket used by the replica to connect with the master.
#
#   Port: The port is communicated by the replica during the replication
#   handshake, and is normally the port that the replica is using to
#   listen for connections.
#
# However when port forwarding or Network Address Translation (NAT) is
# used, the replica may actually be reachable via different IP and port
# pairs. The following two options can be used by a replica in order to
# report to its master a specific set of IP and port, so that both INFO
# and ROLE will report those values.
#
# There is no need to use both the options if you need to override just
# the port or the IP address.
#
# replica-announce-ip 5.5.5.5
# replica-announce-port 1234

############################### KEYS TRACKING #################################

# Redis implements server assisted support for client side caching of values.
# This is implemented using an invalidation table that remembers, using
# 16 millions of slots, what clients may have certain subsets of keys. In turn
# this is used in order to send invalidation messages to clients. Please
# check this page to understand more about the feature:
#
#   https://redis.io/topics/client-side-caching
#
# When tracking is enabled for a client, all the read only queries are assumed
# to be cached: this will force Redis to store information in the invalidation
# table. When keys are modified, such information is flushed away, and
# invalidation messages are sent to the clients. However if the workload is
# heavily dominated by reads, Redis could use more and more memory in order
# to track the keys fetched by many clients.
#
# For this reason it is possible to configure a maximum fill value for the
# invalidation table. By default it is set to 1M of keys, and once this limit
# is reached, Redis will start to evict keys in the invalidation table
# even if they were not modified, just to reclaim memory: this will in turn
# force the clients to invalidate the cached values. Basically the table
# maximum size is a trade off between the memory you want to spend server
# side to track information about who cached what, and the ability of clients
# to retain cached objects in memory.
#
# If you set the value to 0, it means there are no limits, and Redis will
# retain as many keys as needed in the invalidation table.
# In the "stats" INFO section, you can find information about the number of
# keys in the invalidation table at every given moment.
#
# Note: when key tracking is used in broadcasting mode, no memory is used
# in the server side so this setting is useless.
#
# tracking-table-max-keys 1000000

################################## SECURITY ###################################

# Warning: since Redis is pretty fast, an outside user can try up to
# 1 million passwords per second against a modern box. This means that you
# should use very strong passwords, otherwise they will be very easy to break.
# Note that because the password is really a shared secret between the client
# and the server, and should not be memorized by any human, the password
# can be easily a long string from /dev/urandom or whatever, so by using a
# long and unguessable password no brute force attack will be possible.

# Redis ACL users are defined in the following format:
#
#   user <username> ... acl rules ...
#
# For example:
#
#   user worker +@list +@connection ~jobs:* on >ffa9203c493aa99
#
# The special username "default" is used for new connections. If this user
# has the "nopass" rule, then new connections will be immediately authenticated
# as the "default" user without the need of any password provided via the
# AUTH command. Otherwise if the "default" user is not flagged with "nopass"
# the connections will start in not authenticated state, and will require
# AUTH (or the HELLO command AUTH option) in order to be authenticated and
# start to work.
#
# The ACL rules that describe what a user can do are the following:
#
#  on           Enable the user: it is possible to authenticate as this user.
#  off          Disable the user: it's no longer possible to authenticate
#               with this user, however the already authenticated connections
#               will still work.
#  +<command>   Allow the execution of that command
#  -<command>   Disallow the execution of that command
#  +@<category> Allow the execution of all the commands in such category
#               with valid categories are like @admin, @set, @sortedset, ...
#               and so forth, see the full list in the server.c file where
#               the Redis command table is described and defined.
#               The special category @all means all the commands, but currently
#               present in the server, and that will be loaded in the future
#               via modules.
#  +<command>|subcommand    Allow a specific subcommand of an otherwise
#                           disabled command. Note that this form is not
#                           allowed as negative like -DEBUG|SEGFAULT, but
#                           only additive starting with "+".
#  allcommands  Alias for +@all. Note that it implies the ability to execute
#               all the future commands loaded via the modules system.
#  nocommands   Alias for -@all.
#  ~<pattern>   Add a pattern of keys that can be mentioned as part of
#               commands. For instance ~* allows all the keys. The pattern
#               is a glob-style pattern like the one of KEYS.
#               It is possible to specify multiple patterns.
#  allkeys      Alias for ~*
#  resetkeys    Flush the list of allowed keys patterns.
#  ><password>  Add this password to the list of valid password for the user.
#               For example >mypass will add "mypass" to the list.
#               This directive clears the "nopass" flag (see later).
#  <<password>  Remove this password from the list of valid passwords.
#  nopass       All the set passwords of the user are removed, and the user
#               is flagged as requiring no password: it means that every
#               password will work against this user. If this directive is
#               used for the default user, every new connection will be
#               immediately authenticated with the default user without
#               any explicit AUTH command required. Note that the "resetpass"
#               directive will clear this condition.
#  resetpass    Flush the list of allowed passwords. Moreover removes the
#               "nopass" status. After "resetpass" the user has no associated
#               passwords and there is no way to authenticate without adding
#               some password (or setting it as "nopass" later).
#  reset        Performs the following actions: resetpass, resetkeys, off,
#               -@all. The user returns to the same state it has immediately
#               after its creation.
#
# ACL rules can be specified in any order: for instance you can start with
# passwords, then flags, or key patterns. However note that the additive
# and subtractive rules will CHANGE MEANING depending on the ordering.
# For instance see the following example:
#
#   user alice on +@all -DEBUG ~* >somepassword
#
# This will allow "alice" to use all the commands with the exception of the
# DEBUG command, since +@all added all the commands to the set of the commands
# alice can use, and later DEBUG was removed. However if we invert the order
# of two ACL rules the result will be different:
#
#   user alice on -DEBUG +@all ~* >somepassword
#
# Now DEBUG was removed when alice had yet no commands in the set of allowed
# commands, later all the commands are added, so the user will be able to
# execute everything.
#
# Basically ACL rules are processed left-to-right.
#
# For more information about ACL configuration please refer to
# the Redis web site at https://redis.io/topics/acl

# ACL LOG
#
# The ACL Log tracks failed commands and authentication events associated
# with ACLs. The ACL Log is useful to troubleshoot failed commands blocked
# by ACLs. The ACL Log is stored in memory. You can reclaim memory with
# ACL LOG RESET. Define the maximum entry length of the ACL Log below.
acllog-max-len 128

# Using an external ACL file
#
# Instead of configuring users here in this file, it is possible to use
# a stand-alone file just listing users. The two methods cannot be mixed:
# if you configure users here and at the same time you activate the external
# ACL file, the server will refuse to start.
#
# The format of the external ACL user file is exactly the same as the
# format that is used inside redis.conf to describe users.
#
# aclfile /etc/redis/users.acl

# IMPORTANT NOTE: starting with Redis 6 "requirepass" is just a compatibility
# layer on top of the new ACL system. The option effect will be just setting
# the password for the default user. Clients will still authenticate using
# AUTH <password> as usually, or more explicitly with AUTH default <password>
# if they follow the new protocol: both will work.
#
requirepass INSECURE_REDIS_PASSWORD

# Command renaming (DEPRECATED).
#
# ------------------------------------------------------------------------
# WARNING: avoid using this option if possible. Instead use ACLs to remove
# commands from the default user, and put them only in some admin user you
# create for administrative purposes.
# ------------------------------------------------------------------------
#
# It is possible to change the name of dangerous commands in a shared
# environment. For instance the CONFIG command may be renamed into something
# hard to guess so that it will still be available for internal-use tools
# but not available for general clients.
#
# Example:
#
# rename-command CONFIG b840fc02d524045429941cc15f59e41cb7be6c52
#
# It is also possible to completely kill a command by renaming it into
# an empty string:
#
# rename-command CONFIG ""
#
# Please note that changing the name of commands that are logged into the
# AOF file or transmitted to replicas may cause problems.

################################### CLIENTS ####################################

# Set the max number of connected clients at the same time. By default
# this limit is set to 10000 clients, however if the Redis server is not
# able to configure the process file limit to allow for the specified limit
# the max number of allowed clients is set to the current file limit
# minus 32 (as Redis reserves a few file descriptors for internal uses).
#
# Once the limit is reached Redis will close all the new connections sending
# an error 'max number of clients reached'.
#
# IMPORTANT: When Redis Cluster is used, the max number of connections is also
# shared with the cluster bus: every node in the cluster will use two
# connections, one incoming and another outgoing. It is important to size the
# limit accordingly in case of very large clusters.
#
# maxclients 10000

############################## MEMORY MANAGEMENT ################################

# Set a memory usage limit to the specified amount of bytes.
# When the memory limit is reached Redis will try to remove keys
# according to the eviction policy selected (see maxmemory-policy).
#
# If Redis can't remove keys according to the policy, or if the policy is
# set to 'noeviction', Redis will start to reply with errors to commands
# that would use more memory, like SET, LPUSH, and so on, and will continue
# to reply to read-only commands like GET.
#
# This option is usually useful when using Redis as an LRU or LFU cache, or to
# set a hard memory limit for an instance (using the 'noeviction' policy).
#
# WARNING: If you have replicas attached to an instance with maxmemory on,
# the size of the output buffers needed to feed the replicas are subtracted
# from the used memory count, so that network problems / resyncs will
# not trigger a loop where keys are evicted, and in turn the output
# buffer of replicas is full with DELs of keys evicted triggering the deletion
# of more keys, and so forth until the database is completely emptied.
#
# In short... if you have replicas attached it is suggested that you set a lower
# limit for maxmemory so that there is some free RAM on the system for replica
# output buffers (but this is not needed if the policy is 'noeviction').
#
# maxmemory <bytes>

# MAXMEMORY POLICY: how Redis will select what to remove when maxmemory
# is reached. You can select one from the following behaviors:
#
# volatile-lru -> Evict using approximated LRU, only keys with an expire set.
# allkeys-lru -> Evict any key using approximated LRU.
# volatile-lfu -> Evict using approximated LFU, only keys with an expire set.
# allkeys-lfu -> Evict any key using approximated LFU.
# volatile-random -> Remove a random key having an expire set.
# allkeys-random -> Remove a random key, any key.
# volatile-ttl -> Remove the key with the nearest expire time (minor TTL)
# noeviction -> Don't evict anything, just return an error on write operations.
#
# LRU means Least Recently Used
# LFU means Least Frequently Used
#
# Both LRU, LFU and volatile-ttl are implemented using approximated
# randomized algorithms.
#
# Note: with any of the above policies, Redis will return an error on write
#       operations, when there are no suitable keys for eviction.
#
#       At the date of writing these commands are: set setnx setex append
#       incr decr rpush lpush rpushx lpushx linsert lset rpoplpush sadd
#       sinter sinterstore sunion sunionstore sdiff sdiffstore zadd zincrby
#       zunionstore zinterstore hset hsetnx hmset hincrby incrby decrby
#       getset mset msetnx exec sort
#
# The default is:
#
# maxmemory-policy noeviction

# LRU, LFU and minimal TTL algorithms are not precise algorithms but approximated
# algorithms (in order to save memory), so you can tune it for speed or
# accuracy. By default Redis will check five keys and pick the one that was
# used least recently, you can change the sample size using the following
# configuration directive.
#
# The default of 5 produces good enough results. 10 Approximates very closely
# true LRU but costs more CPU. 3 is faster but not very accurate.
#
# maxmemory-samples 5

# Starting from Redis 5, by default a replica will ignore its maxmemory setting
# (unless it is promoted to master after a failover or manually). It means
# that the eviction of keys will be just handled by the master, sending the
# DEL commands to the replica as keys evict in the master side.
#
# This behavior ensures that masters and replicas stay consistent, and is usually
# what you want, however if your replica is writable, or you want the replica
# to have a different memory setting, and you are sure all the writes performed
# to the replica are idempotent, then you may change this default (but be sure
# to understand what you are doing).
#
# Note that since the replica by default does not evict, it may end using more
# memory than the one set via maxmemory (there are certain buffers that may
# be larger on the replica, or data structures may sometimes take more memory
# and so forth). So make sure you monitor your replicas and make sure they
# have enough memory to never hit a real out-of-memory condition before the
# master hits the configured maxmemory setting.
#
# replica-ignore-maxmemory yes

# Redis reclaims expired keys in two ways: upon access when those keys are
# found to be expired, and also in background, in what is called the
# "active expire key". The key space is slowly and interactively scanned
# looking for expired keys to reclaim, so that it is possible to free memory
# of keys that are expired and will never be accessed again in a short time.
#
# The default effort of the expire cycle will try to avoid having more than
# ten percent of expired keys still in memory, and will try to avoid consuming
# more than 25% of total memory and to add latency to the system. However
# it is possible to increase the expire "effort" that is normally set to
# "1", to a greater value, up to the value "10". At its maximum value the
# system will use more CPU, longer cycles (and technically may introduce
# more latency), and will tolerate less already expired keys still present
# in the system. It's a tradeoff between memory, CPU and latency.
#
# active-expire-effort 1

############################# LAZY FREEING ####################################

# Redis has two primitives to delete keys. One is called DEL and is a blocking
# deletion of the object. It means that the server stops processing new commands
# in order to reclaim all the memory associated with an object in a synchronous
# way. If the key deleted is associated with a small object, the time needed
# in order to execute the DEL command is very small and comparable to most other
# O(1) or O(log_N) commands in Redis. However if the key is associated with an
# aggregated value containing millions of elements, the server can block for
# a long time (even seconds) in order to complete the operation.
#
# For the above reasons Redis also offers non blocking deletion primitives
# such as UNLINK (non blocking DEL) and the ASYNC option of FLUSHALL and
# FLUSHDB commands, in order to reclaim memory in background. Those commands
# are executed in constant time. Another thread will incrementally free the
# object in the background as fast as possible.
#
# DEL, UNLINK and ASYNC option of FLUSHALL and FLUSHDB are user-controlled.
# It's up to the design of the application to understand when it is a good
# idea to use one or the other. However the Redis server sometimes has to
# delete keys or flush the whole database as a side effect of other operations.
# Specifically Redis deletes objects independently of a user call in the
# following scenarios:
#
# 1) On eviction, because of the maxmemory and maxmemory policy configurations,
#    in order to make room for new data, without going over the specified
#    memory limit.
# 2) Because of expire: when a key with an associated time to live (see the
#    EXPIRE command) must be deleted from memory.
# 3) Because of a side effect of a command that stores data on a key that may
#    already exist. For example the RENAME command may delete the old key
#    content when it is replaced with another one. Similarly SUNIONSTORE
#    or SORT with STORE option may delete existing keys. The SET command
#    itself removes any old content of the specified key in order to replace
#    it with the specified string.
# 4) During replication, when a replica performs a full resynchronization with
#    its master, the content of the whole database is removed in order to
#    load the RDB file just transferred.
#
# In all the above cases the default is to delete objects in a blocking way,
# like if DEL was called. However you can configure each case specifically
# in order to instead release memory in a non-blocking way like if UNLINK
# was called, using the following configuration directives.

lazyfree-lazy-eviction no
lazyfree-lazy-expire no
lazyfree-lazy-server-del no
replica-lazy-flush no

# It is also possible, for the case when to replace the user code DEL calls
# with UNLINK calls is not easy, to modify the default behavior of the DEL
# command to act exactly like UNLINK, using the following configuration
# directive:

lazyfree-lazy-user-del no

################################ THREADED I/O #################################

# Redis is mostly single threaded, however there are certain threaded
# operations such as UNLINK, slow I/O accesses and other things that are
# performed on side threads.
#
# Now it is also possible to handle Redis clients socket reads and writes
# in different I/O threads. Since especially writing is so slow, normally
# Redis users use pipelining in order to speed up the Redis performances per
# core, and spawn multiple instances in order to scale more. Using I/O
# threads it is possible to easily speedup two times Redis without resorting
# to pipelining nor sharding of the instance.
#
# By default threading is disabled, we suggest enabling it only in machines
# that have at least 4 or more cores, leaving at least one spare core.
# Using more than 8 threads is unlikely to help much. We also recommend using
# threaded I/O only if you actually have performance problems, with Redis
# instances being able to use a quite big percentage of CPU time, otherwise
# there is no point in using this feature.
#
# So for instance if you have a four cores boxes, try to use 2 or 3 I/O
# threads, if you have a 8 cores, try to use 6 threads. In order to
# enable I/O threads use the following configuration directive:
#
# io-threads 4
#
# Setting io-threads to 1 will just use the main thread as usual.
# When I/O threads are enabled, we only use threads for writes, that is
# to thread the write(2) syscall and transfer the client buffers to the
# socket. However it is also possible to enable threading of reads and
# protocol parsing using the following configuration directive, by setting
# it to yes:
#
# io-threads-do-reads no
#
# Usually threading reads doesn't help much.
#
# NOTE 1: This configuration directive cannot be changed at runtime via
# CONFIG SET. Aso this feature currently does not work when SSL is
# enabled.
#
# NOTE 2: If you want to test the Redis speedup using redis-benchmark, make
# sure you also run the benchmark itself in threaded mode, using the
# --threads option to match the number of Redis threads, otherwise you'll not
# be able to notice the improvements.

############################ KERNEL OOM CONTROL ##############################

# On Linux, it is possible to hint the kernel OOM killer on what processes
# should be killed first when out of memory.
#
# Enabling this feature makes Redis actively control the oom_score_adj value
# for all its processes, depending on their role. The default scores will
# attempt to have background child processes killed before all others, and
# replicas killed before masters.
#
# Redis supports three options:
#
# no:       Don't make changes to oom-score-adj (default).
# yes:      Alias to "relative" see below.
# absolute: Values in oom-score-adj-values are written as is to the kernel.
# relative: Values are used relative to the initial value of oom_score_adj when
#           the server starts and are then clamped to a range of -1000 to 1000.
#           Because typically the initial value is 0, they will often match the
#           absolute values.
oom-score-adj no

# When oom-score-adj is used, this directive controls the specific values used
# for master, replica and background child processes. Values range -2000 to
# 2000 (higher means more likely to be killed).
#
# Unprivileged processes (not root, and without CAP_SYS_RESOURCE capabilities)
# can freely increase their value, but not decrease it below its initial
# settings. This means that setting oom-score-adj to "relative" and setting the
# oom-score-adj-values to positive values will always succeed.
oom-score-adj-values 0 200 800

############################## APPEND ONLY MODE ###############################

# By default Redis asynchronously dumps the dataset on disk. This mode is
# good enough in many applications, but an issue with the Redis process or
# a power outage may result into a few minutes of writes lost (depending on
# the configured save points).
#
# The Append Only File is an alternative persistence mode that provides
# much better durability. For instance using the default data fsync policy
# (see later in the config file) Redis can lose just one second of writes in a
# dramatic event like a server power outage, or a single write if something
# wrong with the Redis process itself happens, but the operating system is
# still running correctly.
#
# AOF and RDB persistence can be enabled at the same time without problems.
# If the AOF is enabled on startup Redis will load the AOF, that is the file
# with the better durability guarantees.
#
# Please check http://redis.io/topics/persistence for more information.

appendonly no

# The name of the append only file (default: "appendonly.aof")

appendfilename "appendonly.aof"

# The fsync() call tells the Operating System to actually write data on disk
# instead of waiting for more data in the output buffer. Some OS will really flush
# data on disk, some other OS will just try to do it ASAP.
#
# Redis supports three different modes:
#
# no: don't fsync, just let the OS flush the data when it wants. Faster.
# always: fsync after every write to the append only log. Slow, Safest.
# everysec: fsync only one time every second. Compromise.
#
# The default is "everysec", as that's usually the right compromise between
# speed and data safety. It's up to you to understand if you can relax this to
# "no" that will let the operating system flush the output buffer when
# it wants, for better performances (but if you can live with the idea of
# some data loss consider the default persistence mode that's snapshotting),
# or on the contrary, use "always" that's very slow but a bit safer than
# everysec.
#
# More details please check the following article:
# http://antirez.com/post/redis-persistence-demystified.html
#
# If unsure, use "everysec".

# appendfsync always
appendfsync everysec
# appendfsync no

# When the AOF fsync policy is set to always or everysec, and a background
# saving process (a background save or AOF log background rewriting) is
# performing a lot of I/O against the disk, in some Linux configurations
# Redis may block too long on the fsync() call. Note that there is no fix for
# this currently, as even performing fsync in a different thread will block
# our synchronous write(2) call.
#
# In order to mitigate this problem it's possible to use the following option
# that will prevent fsync() from being called in the main process while a
# BGSAVE or BGREWRITEAOF is in progress.
#
# This means that while another child is saving, the durability of Redis is
# the same as "appendfsync none". In practical terms, this means that it is
# possible to lose up to 30 seconds of log in the worst scenario (with the
# default Linux settings).
#
# If you have latency problems turn this to "yes". Otherwise leave it as
# "no" that is the safest pick from the point of view of durability.

no-appendfsync-on-rewrite no

# Automatic rewrite of the append only file.
# Redis is able to automatically rewrite the log file implicitly calling
# BGREWRITEAOF when the AOF log size grows by the specified percentage.
#
# This is how it works: Redis remembers the size of the AOF file after the
# latest rewrite (if no rewrite has happened since the restart, the size of
# the AOF at startup is used).
#
# This base size is compared to the current size. If the current size is
# bigger than the specified percentage, the rewrite is triggered. Also
# you need to specify a minimal size for the AOF file to be rewritten, this
# is useful to avoid rewriting the AOF file even if the percentage increase
# is reached but it is still pretty small.
#
# Specify a percentage of zero in order to disable the automatic AOF
# rewrite feature.

auto-aof-rewrite-percentage 100
auto-aof-rewrite-min-size 64mb

# An AOF file may be found to be truncated at the end during the Redis
# startup process, when the AOF data gets loaded back into memory.
# This may happen when the system where Redis is running
# crashes, especially when an ext4 filesystem is mounted without the
# data=ordered option (however this can't happen when Redis itself
# crashes or aborts but the operating system still works correctly).
#
# Redis can either exit with an error when this happens, or load as much
# data as possible (the default now) and start if the AOF file is found
# to be truncated at the end. The following option controls this behavior.
#
# If aof-load-truncated is set to yes, a truncated AOF file is loaded and
# the Redis server starts emitting a log to inform the user of the event.
# Otherwise if the option is set to no, the server aborts with an error
# and refuses to start. When the option is set to no, the user requires
# to fix the AOF file using the "redis-check-aof" utility before to restart
# the server.
#
# Note that if the AOF file will be found to be corrupted in the middle
# the server will still exit with an error. This option only applies when
# Redis will try to read more data from the AOF file but not enough bytes
# will be found.
aof-load-truncated yes

# When rewriting the AOF file, Redis is able to use an RDB preamble in the
# AOF file for faster rewrites and recoveries. When this option is turned
# on the rewritten AOF file is composed of two different stanzas:
#
#   [RDB file][AOF tail]
#
# When loading, Redis recognizes that the AOF file starts with the "REDIS"
# string and loads the prefixed RDB file, then continues loading the AOF
# tail.
aof-use-rdb-preamble yes

################################ LUA SCRIPTING  ###############################

# Max execution time of a Lua script in milliseconds.
#
# If the maximum execution time is reached Redis will log that a script is
# still in execution after the maximum allowed time and will start to
# reply to queries with an error.
#
# When a long running script exceeds the maximum execution time only the
# SCRIPT KILL and SHUTDOWN NOSAVE commands are available. The first can be
# used to stop a script that did not yet call any write commands. The second
# is the only way to shut down the server in the case a write command was
# already issued by the script but the user doesn't want to wait for the natural
# termination of the script.
#
# Set it to 0 or a negative value for unlimited execution without warnings.
lua-time-limit 5000

################################ REDIS CLUSTER  ###############################

# Normal Redis instances can't be part of a Redis Cluster; only nodes that are
# started as cluster nodes can. In order to start a Redis instance as a
# cluster node enable the cluster support uncommenting the following:
#
# cluster-enabled yes

# Every cluster node has a cluster configuration file. This file is not
# intended to be edited by hand. It is created and updated by Redis nodes.
# Every Redis Cluster node requires a different cluster configuration file.
# Make sure that instances running in the same system do not have
# overlapping cluster configuration file names.
#
# cluster-config-file nodes-6379.conf

# Cluster node timeout is the amount of milliseconds a node must be unreachable
# for it to be considered in failure state.
# Most other internal time limits are a multiple of the node timeout.
#
# cluster-node-timeout 15000

# A replica of a failing master will avoid to start a failover if its data
# looks too old.
#
# There is no simple way for a replica to actually have an exact measure of
# its "data age", so the following two checks are performed:
#
# 1) If there are multiple replicas able to failover, they exchange messages
#    in order to try to give an advantage to the replica with the best
#    replication offset (more data from the master processed).
#    Replicas will try to get their rank by offset, and apply to the start
#    of the failover a delay proportional to their rank.
#
# 2) Every single replica computes the time of the last interaction with
#    its master. This can be the last ping or command received (if the master
#    is still in the "connected" state), or the time that elapsed since the
#    disconnection with the master (if the replication link is currently down).
#    If the last interaction is too old, the replica will not try to failover
#    at all.
#
# The point "2" can be tuned by user. Specifically a replica will not perform
# the failover if, since the last interaction with the master, the time
# elapsed is greater than:
#
#   (node-timeout * cluster-replica-validity-factor) + repl-ping-replica-period
#
# So for example if node-timeout is 30 seconds, and the cluster-replica-validity-factor
# is 10, and assuming a default repl-ping-replica-period of 10 seconds, the
# replica will not try to failover if it was not able to talk with the master
# for longer than 310 seconds.
#
# A large cluster-replica-validity-factor may allow replicas with too old data to failover
# a master, while a too small value may prevent the cluster from being able to
# elect a replica at all.
#
# For maximum availability, it is possible to set the cluster-replica-validity-factor
# to a value of 0, which means, that replicas will always try to failover the
# master regardless of the last time they interacted with the master.
# (However they'll always try to apply a delay proportional to their
# offset rank).
#
# Zero is the only value able to guarantee that when all the partitions heal
# the cluster will always be able to continue.
#
# cluster-replica-validity-factor 10

# Cluster replicas are able to migrate to orphaned masters, that are masters
# that are left without working replicas. This improves the cluster ability
# to resist to failures as otherwise an orphaned master can't be failed over
# in case of failure if it has no working replicas.
#
# Replicas migrate to orphaned masters only if there are still at least a
# given number of other working replicas for their old master. This number
# is the "migration barrier". A migration barrier of 1 means that a replica
# will migrate only if there is at least 1 other working replica for its master
# and so forth. It usually reflects the number of replicas you want for every
# master in your cluster.
#
# Default is 1 (replicas migrate only if their masters remain with at least
# one replica). To disable migration just set it to a very large value.
# A value of 0 can be set but is useful only for debugging and dangerous
# in production.
#
# cluster-migration-barrier 1

# By default Redis Cluster nodes stop accepting queries if they detect there
# is at least a hash slot uncovered (no available node is serving it).
# This way if the cluster is partially down (for example a range of hash slots
# are no longer covered) all the cluster becomes, eventually, unavailable.
# It automatically returns available as soon as all the slots are covered again.
#
# However sometimes you want the subset of the cluster which is working,
# to continue to accept queries for the part of the key space that is still
# covered. In order to do so, just set the cluster-require-full-coverage
# option to no.
#
# cluster-require-full-coverage yes

# This option, when set to yes, prevents replicas from trying to failover its
# master during master failures. However the master can still perform a
# manual failover, if forced to do so.
#
# This is useful in different scenarios, especially in the case of multiple
# data center operations, where we want one side to never be promoted if not
# in the case of a total DC failure.
#
# cluster-replica-no-failover no

# This option, when set to yes, allows nodes to serve read traffic while the
# the cluster is in a down state, as long as it believes it owns the slots.
#
# This is useful for two cases.  The first case is for when an application
# doesn't require consistency of data during node failures or network partitions.
# One example of this is a cache, where as long as the node has the data it
# should be able to serve it.
#
# The second use case is for configurations that don't meet the recommended
# three shards but want to enable cluster mode and scale later. A
# master outage in a 1 or 2 shard configuration causes a read/write outage to the
# entire cluster without this option set, with it set there is only a write outage.
# Without a quorum of masters, slot ownership will not change automatically.
#
# cluster-allow-reads-when-down no

# In order to setup your cluster make sure to read the documentation
# available at http://redis.io web site.

########################## CLUSTER DOCKER/NAT support  ########################

# In certain deployments, Redis Cluster nodes address discovery fails, because
# addresses are NAT-ted or because ports are forwarded (the typical case is
# Docker and other containers).
#
# In order to make Redis Cluster working in such environments, a static
# configuration where each node knows its public address is needed. The
# following two options are used for this scope, and are:
#
# * cluster-announce-ip
# * cluster-announce-port
# * cluster-announce-bus-port
#
# Each instructs the node about its address, client port, and cluster message
# bus port. The information is then published in the header of the bus packets
# so that other nodes will be able to correctly map the address of the node
# publishing the information.
#
# If the above options are not used, the normal Redis Cluster auto-detection
# will be used instead.
#
# Note that when remapped, the bus port may not be at the fixed offset of
# clients port + 10000, so you can specify any port and bus-port depending
# on how they get remapped. If the bus-port is not set, a fixed offset of
# 10000 will be used as usual.
#
# Example:
#
# cluster-announce-ip 10.1.1.5
# cluster-announce-port 6379
# cluster-announce-bus-port 6380

################################## SLOW LOG ###################################

# The Redis Slow Log is a system to log queries that exceeded a specified
# execution time. The execution time does not include the I/O operations
# like talking with the client, sending the reply and so forth,
# but just the time needed to actually execute the command (this is the only
# stage of command execution where the thread is blocked and can not serve
# other requests in the meantime).
#
# You can configure the slow log with two parameters: one tells Redis
# what is the execution time, in microseconds, to exceed in order for the
# command to get logged, and the other parameter is the length of the
# slow log. When a new command is logged the oldest one is removed from the
# queue of logged commands.

# The following time is expressed in microseconds, so 1000000 is equivalent
# to one second. Note that a negative number disables the slow log, while
# a value of zero forces the logging of every command.
slowlog-log-slower-than 10000

# There is no limit to this length. Just be aware that it will consume memory.
# You can reclaim memory used by the slow log with SLOWLOG RESET.
slowlog-max-len 128

################################ LATENCY MONITOR ##############################

# The Redis latency monitoring subsystem samples different operations
# at runtime in order to collect data related to possible sources of
# latency of a Redis instance.
#
# Via the LATENCY command this information is available to the user that can
# print graphs and obtain reports.
#
# The system only logs operations that were performed in a time equal or
# greater than the amount of milliseconds specified via the
# latency-monitor-threshold configuration directive. When its value is set
# to zero, the latency monitor is turned off.
#
# By default latency monitoring is disabled since it is mostly not needed
# if you don't have latency issues, and collecting data has a performance
# impact, that while very small, can be measured under big load. Latency
# monitoring can easily be enabled at runtime using the command
# "CONFIG SET latency-monitor-threshold <milliseconds>" if needed.
latency-monitor-threshold 0

############################# EVENT NOTIFICATION ##############################

# Redis can notify Pub/Sub clients about events happening in the key space.
# This feature is documented at http://redis.io/topics/notifications
#
# For instance if keyspace events notification is enabled, and a client
# performs a DEL operation on key "foo" stored in the Database 0, two
# messages will be published via Pub/Sub:
#
# PUBLISH __keyspace@0__:foo del
# PUBLISH __keyevent@0__:del foo
#
# It is possible to select the events that Redis will notify among a set
# of classes. Every class is identified by a single character:
#
#  K     Keyspace events, published with __keyspace@<db>__ prefix.
#  E     Keyevent events, published with __keyevent@<db>__ prefix.
#  g     Generic commands (non-type specific) like DEL, EXPIRE, RENAME, ...
#  $     String commands
#  l     List commands
#  s     Set commands
#  h     Hash commands
#  z     Sorted set commands
#  x     Expired events (events generated every time a key expires)
#  e     Evicted events (events generated when a key is evicted for maxmemory)
#  t     Stream commands
#  m     Key-miss events (Note: It is not included in the 'A' class)
#  A     Alias for g$lshzxet, so that the "AKE" string means all the events
#        (Except key-miss events which are excluded from 'A' due to their
#         unique nature).
#
#  The "notify-keyspace-events" takes as argument a string that is composed
#  of zero or multiple characters. The empty string means that notifications
#  are disabled.
#
#  Example: to enable list and generic events, from the point of view of the
#           event name, use:
#
#  notify-keyspace-events Elg
#
#  Example 2: to get the stream of the expired keys subscribing to channel
#             name __keyevent@0__:expired use:
#
#  notify-keyspace-events Ex
#
#  By default all notifications are disabled because most users don't need
#  this feature and the feature has some overhead. Note that if you don't
#  specify at least one of K or E, no events will be delivered.
notify-keyspace-events ""

############################### GOPHER SERVER #################################

# Redis contains an implementation of the Gopher protocol, as specified in
# the RFC 1436 (https://www.ietf.org/rfc/rfc1436.txt).
#
# The Gopher protocol was very popular in the late '90s. It is an alternative
# to the web, and the implementation both server and client side is so simple
# that the Redis server has just 100 lines of code in order to implement this
# support.
#
# What do you do with Gopher nowadays? Well Gopher never *really* died, and
# lately there is a movement in order for the Gopher more hierarchical content
# composed of just plain text documents to be resurrected. Some want a simpler
# internet, others believe that the mainstream internet became too much
# controlled, and it's cool to create an alternative space for people that
# want a bit of fresh air.
#
# Anyway for the 10nth birthday of the Redis, we gave it the Gopher protocol
# as a gift.
#
# --- HOW IT WORKS? ---
#
# The Redis Gopher support uses the inline protocol of Redis, and specifically
# two kind of inline requests that were anyway illegal: an empty request
# or any request that starts with "/" (there are no Redis commands starting
# with such a slash). Normal RESP2/RESP3 requests are completely out of the
# path of the Gopher protocol implementation and are served as usual as well.
#
# If you open a connection to Redis when Gopher is enabled and send it
# a string like "/foo", if there is a key named "/foo" it is served via the
# Gopher protocol.
#
# In order to create a real Gopher "hole" (the name of a Gopher site in Gopher
# talking), you likely need a script like the following:
#
#   https://github.com/antirez/gopher2redis
#
# --- SECURITY WARNING ---
#
# If you plan to put Redis on the internet in a publicly accessible address
# to server Gopher pages MAKE SURE TO SET A PASSWORD to the instance.
# Once a password is set:
#
#   1. The Gopher server (when enabled, not by default) will still serve
#      content via Gopher.
#   2. However other commands cannot be called before the client will
#      authenticate.
#
# So use the 'requirepass' option to protect your instance.
#
# Note that Gopher is not currently supported when 'io-threads-do-reads'
# is enabled.
#
# To enable Gopher support, uncomment the following line and set the option
# from no (the default) to yes.
#
# gopher-enabled no

############################### ADVANCED CONFIG ###############################

# Hashes are encoded using a memory efficient data structure when they have a
# small number of entries, and the biggest entry does not exceed a given
# threshold. These thresholds can be configured using the following directives.
hash-max-ziplist-entries 512
hash-max-ziplist-value 64

# Lists are also encoded in a special way to save a lot of space.
# The number of entries allowed per internal list node can be specified
# as a fixed maximum size or a maximum number of elements.
# For a fixed maximum size, use -5 through -1, meaning:
# -5: max size: 64 Kb  <-- not recommended for normal workloads
# -4: max size: 32 Kb  <-- not recommended
# -3: max size: 16 Kb  <-- probably not recommended
# -2: max size: 8 Kb   <-- good
# -1: max size: 4 Kb   <-- good
# Positive numbers mean store up to _exactly_ that number of elements
# per list node.
# The highest performing option is usually -2 (8 Kb size) or -1 (4 Kb size),
# but if your use case is unique, adjust the settings as necessary.
list-max-ziplist-size -2

# Lists may also be compressed.
# Compress depth is the number of quicklist ziplist nodes from *each* side of
# the list to *exclude* from compression.  The head and tail of the list
# are always uncompressed for fast push/pop operations.  Settings are:
# 0: disable all list compression
# 1: depth 1 means "don't start compressing until after 1 node into the list,
#    going from either the head or tail"
#    So: [head]->node->node->...->node->[tail]
#    [head], [tail] will always be uncompressed; inner nodes will compress.
# 2: [head]->[next]->node->node->...->node->[prev]->[tail]
#    2 here means: don't compress head or head->next or tail->prev or tail,
#    but compress all nodes between them.
# 3: [head]->[next]->[next]->node->node->...->node->[prev]->[prev]->[tail]
# etc.
list-compress-depth 0

# Sets have a special encoding in just one case: when a set is composed
# of just strings that happen to be integers in radix 10 in the range
# of 64 bit signed integers.
# The following configuration setting sets the limit in the size of the
# set in order to use this special memory saving encoding.
set-max-intset-entries 512

# Similarly to hashes and lists, sorted sets are also specially encoded in
# order to save a lot of space. This encoding is only used when the length and
# elements of a sorted set are below the following limits:
zset-max-ziplist-entries 128
zset-max-ziplist-value 64

# HyperLogLog sparse representation bytes limit. The limit includes the
# 16 bytes header. When an HyperLogLog using the sparse representation crosses
# this limit, it is converted into the dense representation.
#
# A value greater than 16000 is totally useless, since at that point the
# dense representation is more memory efficient.
#
# The suggested value is ~ 3000 in order to have the benefits of
# the space efficient encoding without slowing down too much PFADD,
# which is O(N) with the sparse encoding. The value can be raised to
# ~ 10000 when CPU is not a concern, but space is, and the data set is
# composed of many HyperLogLogs with cardinality in the 0 - 15000 range.
hll-sparse-max-bytes 3000

# Streams macro node max size / items. The stream data structure is a radix
# tree of big nodes that encode multiple items inside. Using this configuration
# it is possible to configure how big a single node can be in bytes, and the
# maximum number of items it may contain before switching to a new node when
# appending new stream entries. If any of the following settings are set to
# zero, the limit is ignored, so for instance it is possible to set just a
# max entires limit by setting max-bytes to 0 and max-entries to the desired
# value.
stream-node-max-bytes 4096
stream-node-max-entries 100

# Active rehashing uses 1 millisecond every 100 milliseconds of CPU time in
# order to help rehashing the main Redis hash table (the one mapping top-level
# keys to values). The hash table implementation Redis uses (see dict.c)
# performs a lazy rehashing: the more operation you run into a hash table
# that is rehashing, the more rehashing "steps" are performed, so if the
# server is idle the rehashing is never complete and some more memory is used
# by the hash table.
#
# The default is to use this millisecond 10 times every second in order to
# actively rehash the main dictionaries, freeing memory when possible.
#
# If unsure:
# use "activerehashing no" if you have hard latency requirements and it is
# not a good thing in your environment that Redis can reply from time to time
# to queries with 2 milliseconds delay.
#
# use "activerehashing yes" if you don't have such hard requirements but
# want to free memory asap when possible.
activerehashing yes

# The client output buffer limits can be used to force disconnection of clients
# that are not reading data from the server fast enough for some reason (a
# common reason is that a Pub/Sub client can't consume messages as fast as the
# publisher can produce them).
#
# The limit can be set differently for the three different classes of clients:
#
# normal -> normal clients including MONITOR clients
# replica  -> replica clients
# pubsub -> clients subscribed to at least one pubsub channel or pattern
#
# The syntax of every client-output-buffer-limit directive is the following:
#
# client-output-buffer-limit <class> <hard limit> <soft limit> <soft seconds>
#
# A client is immediately disconnected once the hard limit is reached, or if
# the soft limit is reached and remains reached for the specified number of
# seconds (continuously).
# So for instance if the hard limit is 32 megabytes and the soft limit is
# 16 megabytes / 10 seconds, the client will get disconnected immediately
# if the size of the output buffers reach 32 megabytes, but will also get
# disconnected if the client reaches 16 megabytes and continuously overcomes
# the limit for 10 seconds.
#
# By default normal clients are not limited because they don't receive data
# without asking (in a push way), but just after a request, so only
# asynchronous clients may create a scenario where data is requested faster
# than it can read.
#
# Instead there is a default limit for pubsub and replica clients, since
# subscribers and replicas receive data in a push fashion.
#
# Both the hard or the soft limit can be disabled by setting them to zero.
client-output-buffer-limit normal 0 0 0
client-output-buffer-limit replica 256mb 64mb 60
client-output-buffer-limit pubsub 32mb 8mb 60

# Client query buffers accumulate new commands. They are limited to a fixed
# amount by default in order to avoid that a protocol desynchronization (for
# instance due to a bug in the client) will lead to unbound memory usage in
# the query buffer. However you can configure it here if you have very special
# needs, such us huge multi/exec requests or alike.
#
# client-query-buffer-limit 1gb

# In the Redis protocol, bulk requests, that are, elements representing single
# strings, are normally limited to 512 mb. However you can change this limit
# here, but must be 1mb or greater
#
# proto-max-bulk-len 512mb

# Redis calls an internal function to perform many background tasks, like
# closing connections of clients in timeout, purging expired keys that are
# never requested, and so forth.
#
# Not all tasks are performed with the same frequency, but Redis checks for
# tasks to perform according to the specified "hz" value.
#
# By default "hz" is set to 10. Raising the value will use more CPU when
# Redis is idle, but at the same time will make Redis more responsive when
# there are many keys expiring at the same time, and timeouts may be
# handled with more precision.
#
# The range is between 1 and 500, however a value over 100 is usually not
# a good idea. Most users should use the default of 10 and raise this up to
# 100 only in environments where very low latency is required.
hz 10

# Normally it is useful to have an HZ value which is proportional to the
# number of clients connected. This is useful in order, for instance, to
# avoid too many clients are processed for each background task invocation
# in order to avoid latency spikes.
#
# Since the default HZ value by default is conservatively set to 10, Redis
# offers, and enables by default, the ability to use an adaptive HZ value
# which will temporarily raise when there are many connected clients.
#
# When dynamic HZ is enabled, the actual configured HZ will be used
# as a baseline, but multiples of the configured HZ value will be actually
# used as needed once more clients are connected. In this way an idle
# instance will use very little CPU time while a busy instance will be
# more responsive.
dynamic-hz yes

# When a child rewrites the AOF file, if the following option is enabled
# the file will be fsync-ed every 32 MB of data generated. This is useful
# in order to commit the file to the disk more incrementally and avoid
# big latency spikes.
aof-rewrite-incremental-fsync yes

# When redis saves RDB file, if the following option is enabled
# the file will be fsync-ed every 32 MB of data generated. This is useful
# in order to commit the file to the disk more incrementally and avoid
# big latency spikes.
rdb-save-incremental-fsync yes

# Redis LFU eviction (see maxmemory setting) can be tuned. However it is a good
# idea to start with the default settings and only change them after investigating
# how to improve the performances and how the keys LFU change over time, which
# is possible to inspect via the OBJECT FREQ command.
#
# There are two tunable parameters in the Redis LFU implementation: the
# counter logarithm factor and the counter decay time. It is important to
# understand what the two parameters mean before changing them.
#
# The LFU counter is just 8 bits per key, it's maximum value is 255, so Redis
# uses a probabilistic increment with logarithmic behavior. Given the value
# of the old counter, when a key is accessed, the counter is incremented in
# this way:
#
# 1. A random number R between 0 and 1 is extracted.
# 2. A probability P is calculated as 1/(old_value*lfu_log_factor+1).
# 3. The counter is incremented only if R < P.
#
# The default lfu-log-factor is 10. This is a table of how the frequency
# counter changes with a different number of accesses with different
# logarithmic factors:
#
# +--------+------------+------------+------------+------------+------------+
# | factor | 100 hits   | 1000 hits  | 100K hits  | 1M hits    | 10M hits   |
# +--------+------------+------------+------------+------------+------------+
# | 0      | 104        | 255        | 255        | 255        | 255        |
# +--------+------------+------------+------------+------------+------------+
# | 1      | 18         | 49         | 255        | 255        | 255        |
# +--------+------------+------------+------------+------------+------------+
# | 10     | 10         | 18         | 142        | 255        | 255        |
# +--------+------------+------------+------------+------------+------------+
# | 100    | 8          | 11         | 49         | 143        | 255        |
# +--------+------------+------------+------------+------------+------------+
#
# NOTE: The above table was obtained by running the following commands:
#
#   redis-benchmark -n 1000000 incr foo
#   redis-cli object freq foo
#
# NOTE 2: The counter initial value is 5 in order to give new objects a chance
# to accumulate hits.
#
# The counter decay time is the time, in minutes, that must elapse in order
# for the key counter to be divided by two (or decremented if it has a value
# less <= 10).
#
# The default value for the lfu-decay-time is 1. A special value of 0 means to
# decay the counter every time it happens to be scanned.
#
# lfu-log-factor 10
# lfu-decay-time 1

########################### ACTIVE DEFRAGMENTATION #######################
#
# What is active defragmentation?
# -------------------------------
#
# Active (online) defragmentation allows a Redis server to compact the
# spaces left between small allocations and deallocations of data in memory,
# thus allowing to reclaim back memory.
#
# Fragmentation is a natural process that happens with every allocator (but
# less so with Jemalloc, fortunately) and certain workloads. Normally a server
# restart is needed in order to lower the fragmentation, or at least to flush
# away all the data and create it again. However thanks to this feature
# implemented by Oran Agra for Redis 4.0 this process can happen at runtime
# in a "hot" way, while the server is running.
#
# Basically when the fragmentation is over a certain level (see the
# configuration options below) Redis will start to create new copies of the
# values in contiguous memory regions by exploiting certain specific Jemalloc
# features (in order to understand if an allocation is causing fragmentation
# and to allocate it in a better place), and at the same time, will release the
# old copies of the data. This process, repeated incrementally for all the keys
# will cause the fragmentation to drop back to normal values.
#
# Important things to understand:
#
# 1. This feature is disabled by default, and only works if you compiled Redis
#    to use the copy of Jemalloc we ship with the source code of Redis.
#    This is the default with Linux builds.
#
# 2. You never need to enable this feature if you don't have fragmentation
#    issues.
#
# 3. Once you experience fragmentation, you can enable this feature when
#    needed with the command "CONFIG SET activedefrag yes".
#
# The configuration parameters are able to fine tune the behavior of the
# defragmentation process. If you are not sure about what they mean it is
# a good idea to leave the defaults untouched.

# Enabled active defragmentation
# activedefrag no

# Minimum amount of fragmentation waste to start active defrag
# active-defrag-ignore-bytes 100mb

# Minimum percentage of fragmentation to start active defrag
# active-defrag-threshold-lower 10

# Maximum percentage of fragmentation at which we use maximum effort
# active-defrag-threshold-upper 100

# Minimal effort for defrag in CPU percentage, to be used when the lower
# threshold is reached
# active-defrag-cycle-min 1

# Maximal effort for defrag in CPU percentage, to be used when the upper
# threshold is reached
# active-defrag-cycle-max 25

# Maximum number of set/hash/zset/list fields that will be processed from
# the main dictionary scan
# active-defrag-max-scan-fields 1000

# Jemalloc background thread for purging will be enabled by default
jemalloc-bg-thread yes

# It is possible to pin different threads and processes of Redis to specific
# CPUs in your system, in order to maximize the performances of the server.
# This is useful both in order to pin different Redis threads in different
# CPUs, but also in order to make sure that multiple Redis instances running
# in the same host will be pinned to different CPUs.
#
# Normally you can do this using the "taskset" command, however it is also
# possible to this via Redis configuration directly, both in Linux and FreeBSD.
#
# You can pin the server/IO threads, bio threads, aof rewrite child process, and
# the bgsave child process. The syntax to specify the cpu list is the same as
# the taskset command:
#
# Set redis server/io threads to cpu affinity 0,2,4,6:
# server_cpulist 0-7:2
#
# Set bio threads to cpu affinity 1,3:
# bio_cpulist 1,3
#
# Set aof rewrite child process to cpu affinity 8,9,10,11:
# aof_rewrite_cpulist 8-11
#
# Set bgsave child process to cpu affinity 1,10,11
# bgsave_cpulist 1,10-11

# In some cases redis will emit warnings and even refuse to start if it detects
# that the system is in bad state, it is possible to suppress these warnings
# by setting the following config which takes a space delimited list of warnings
# to suppress
#
# ignore-warnings ARM64-COW-BUG
Scylla
Deploy ScyllaDB
ScyllaDB is a highly-scalable distributed wide-column data store. Thorium uses Scylla for data storage that requires eventual, but not immediate consistency. Thorium will greatly benefit from a high performance deployment of ScyllaDB via fast backing storage and scaled up ScyllaDB cluster membership.
1) Deploy the Cert Manager
kubectl apply -f https://github.com/cert-manager/cert-manager/releases/download/v1.17.1/cert-manager.yaml
kubectl wait --for condition=established crd/certificates.cert-manager.io crd/issuers.cert-manager.io
sleep 10
kubectl -n cert-manager rollout status deployment.apps/cert-manager-webhook -w
2) Create the Scylla Operator
git clone github.com/scylladb/scylla-operator.git
kubectl apply -f scylla-operator/deploy/operator.yaml
sleep 10
kubectl wait --for condition=established crd/scyllaclusters.scylla.scylladb.com
kubectl -n scylla-operator rollout status deployment.apps/scylla-operator -w
3) Create the ScyllaDB Cluster
Consider updating these fields in the following resource file before applying them with kubectl:
versionagentVersionmemberscapacitystorageClassNameresources.[requests,limits].memoryresources.[requests,limits].cpu
cat <<EOF | kubectl apply -f -
# Namespace where the Scylla Cluster will be created
apiVersion: v1
kind: Namespace
metadata:
  name: scylla
---
# Simple Scylla Cluster
apiVersion: scylla.scylladb.com/v1
kind: ScyllaCluster
metadata:
  labels:
    controller-tools.k8s.io: "1.0"
  name: scylla
  namespace: scylla
spec:
  version: 5.4.9
  agentVersion: 3.4.1
  developerMode: false
  sysctls:
    - fs.aio-max-nr=30000000
  datacenter:
    name: us-east-1
    racks:
      - name: us-east-1a
        scyllaConfig: "scylla-config"
        scyllaAgentConfig: "scylla-agent-config"
        members: 3
        storage:
          capacity: 20Ti
          storageClassName: csi-rbd-sc
        resources:
          requests:
            cpu: 8
            memory: 32Gi
          limits:
            cpu: 8
            memory: 32Gi
        volumes:
          - name: coredumpfs
            hostPath:
              path: /tmp/coredumps
        volumeMounts:
          - mountPath: /tmp/coredumps
            name: coredumpfs
EOF
4) Update Scylla config and restart nodes
Copy the YAML config from the appendices of this section and write it to a file called scylla.yaml.
Then create a K8s ConfigMap using that file and run a rolling reboot of Scylla’s StatefulSet so the
DB will use that config upon restart.
kubectl rollout status --watch --timeout=600s statefulset/scylla-us-east-1-us-east-1a -n scylla
kubectl create cm scylla-config --from-file ./scylla.yaml -n scylla
sleep 10
kubectl rollout restart -n scylla statefulset.apps/scylla-us-east-1-us-east-1a
sleep 10
kubectl rollout status --watch --timeout=600s statefulset/scylla-us-east-1-us-east-1a -n scylla
5) Configure thorium role and replication settings
Once all Scylla nodes are up and Running you can configure the Thorium role and keyspace and disable
the default cassandra user with it’s insecure default password. Be sure to update the
INSECURE_SCYLLA_PASSWORD value below to an appropriately secure value. The text block can be edited
before copy-pasting the command into a terminal. You may also want to change the replication_factor
for small deployments with less than 3 Scylla nodes.
# setup thorium role
kubectl -n scylla exec -i --tty=false pod/scylla-us-east-1-us-east-1a-0 -- /bin/bash << EOF
cqlsh 'scylla-us-east-1-us-east-1a-0.scylla.svc.cluster.local' -u cassandra -p cassandra -e "CREATE ROLE admin with SUPERUSER = true"
cqlsh 'scylla-us-east-1-us-east-1a-0.scylla.svc.cluster.local' -u cassandra -p cassandra -e "CREATE ROLE thorium WITH PASSWORD = 'INSECURE_SCYLLA_PASSWORD' AND LOGIN = true"
cqlsh 'scylla-us-east-1-us-east-1a-0.scylla.svc.cluster.local' -u cassandra -p cassandra -e "GRANT admin to thorium"
cqlsh 'scylla-us-east-1-us-east-1a-0.scylla.svc.cluster.local' -u cassandra -p cassandra -e "CREATE KEYSPACE IF NOT EXISTS thorium WITH REPLICATION = {'class': 'SimpleStrategy', 'replication_factor': 3}"
cqlsh 'scylla-us-east-1-us-east-1a-0.scylla.svc.cluster.local' -u cassandra -p cassandra -e "GRANT ALL ON KEYSPACE thorium TO thorium"
cqlsh 'scylla-us-east-1-us-east-1a-0.scylla.svc.cluster.local' -u cassandra -p cassandra -e "GRANT CREATE ON ALL KEYSPACES TO thorium"
cqlsh 'scylla-us-east-1-us-east-1a-0.scylla.svc.cluster.local' -u thorium -p INSECURE_SCYLLA_PASSWORD -e "DROP ROLE cassandra"
EOF
Appendices
Example scylla.yaml config:
# Scylla storage config YAML

#######################################
# This file is split to two sections:
# 1. Supported parameters
# 2. Unsupported parameters: reserved for future use or backwards
#    compatibility.
# Scylla will only read and use the first segment
#######################################

### Supported Parameters

# The name of the cluster. This is mainly used to prevent machines in
# one logical cluster from joining another.
# It is recommended to change the default value when creating a new cluster.
# You can NOT modify this value for an existing cluster
#cluster_name: 'Test Cluster'

# This defines the number of tokens randomly assigned to this node on the ring
# The more tokens, relative to other nodes, the larger the proportion of data
# that this node will store. You probably want all nodes to have the same number
# of tokens assuming they have equal hardware capability.
num_tokens: 256

# Directory where Scylla should store all its files, which are commitlog,
# data, hints, view_hints and saved_caches subdirectories. All of these
# subs can be overriden by the respective options below.
# If unset, the value defaults to /var/lib/scylla
# workdir: /var/lib/scylla

# Directory where Scylla should store data on disk.
# data_file_directories:
#    - /var/lib/scylla/data

# commit log.  when running on magnetic HDD, this should be a
# separate spindle than the data directories.
# commitlog_directory: /var/lib/scylla/commitlog

# commitlog_sync may be either "periodic" or "batch."
#
# When in batch mode, Scylla won't ack writes until the commit log
# has been fsynced to disk.  It will wait
# commitlog_sync_batch_window_in_ms milliseconds between fsyncs.
# This window should be kept short because the writer threads will
# be unable to do extra work while waiting.  (You may need to increase
# concurrent_writes for the same reason.)
#
# commitlog_sync: batch
# commitlog_sync_batch_window_in_ms: 2
#
# the other option is "periodic" where writes may be acked immediately
# and the CommitLog is simply synced every commitlog_sync_period_in_ms
# milliseconds.
commitlog_sync: periodic
commitlog_sync_period_in_ms: 10000

# The size of the individual commitlog file segments.  A commitlog
# segment may be archived, deleted, or recycled once all the data
# in it (potentially from each columnfamily in the system) has been
# flushed to sstables.
#
# The default size is 32, which is almost always fine, but if you are
# archiving commitlog segments (see commitlog_archiving.properties),
# then you probably want a finer granularity of archiving; 8 or 16 MB
# is reasonable.
commitlog_segment_size_in_mb: 32

# seed_provider class_name is saved for future use.
# A seed address is mandatory.
seed_provider:
    # The addresses of hosts that will serve as contact points for the joining node.
    # It allows the node to discover the cluster ring topology on startup (when
    # joining the cluster).
    # Once the node has joined the cluster, the seed list has no function.
    - class_name: org.apache.cassandra.locator.SimpleSeedProvider
      parameters:
          # In a new cluster, provide the address of the first node.
          # In an existing cluster, specify the address of at least one existing node.
          # If you specify addresses of more than one node, use a comma to separate them.
          # For example: "<IP1>,<IP2>,<IP3>"
          - seeds: "127.0.0.1"

# Address to bind to and tell other Scylla nodes to connect to.
# You _must_ change this if you want multiple nodes to be able to communicate!
#
# If you leave broadcast_address (below) empty, then setting listen_address
# to 0.0.0.0 is wrong as other nodes will not know how to reach this node.
# If you set broadcast_address, then you can set listen_address to 0.0.0.0.
listen_address: 0.0.0.0

# Address to broadcast to other Scylla nodes
# Leaving this blank will set it to the same value as listen_address
broadcast_address: 10.233.13.110


# When using multiple physical network interfaces, set this to true to listen on broadcast_address
# in addition to the listen_address, allowing nodes to communicate in both interfaces.
# Ignore this property if the network configuration automatically routes between the public and private networks such as EC2.
#
# listen_on_broadcast_address: false

# port for the CQL native transport to listen for clients on
# For security reasons, you should not expose this port to the internet. Firewall it if needed.
# To disable the CQL native transport, remove this option and configure native_transport_port_ssl.
native_transport_port: 9042

# Like native_transport_port, but clients are forwarded to specific shards, based on the
# client-side port numbers.
native_shard_aware_transport_port: 19042

# Enabling native transport encryption in client_encryption_options allows you to either use
# encryption for the standard port or to use a dedicated, additional port along with the unencrypted
# standard native_transport_port.
# Enabling client encryption and keeping native_transport_port_ssl disabled will use encryption
# for native_transport_port. Setting native_transport_port_ssl to a different value
# from native_transport_port will use encryption for native_transport_port_ssl while
# keeping native_transport_port unencrypted.
#native_transport_port_ssl: 9142

# Like native_transport_port_ssl, but clients are forwarded to specific shards, based on the
# client-side port numbers.
#native_shard_aware_transport_port_ssl: 19142

# How long the coordinator should wait for read operations to complete
read_request_timeout_in_ms: 5000

# How long the coordinator should wait for writes to complete
write_request_timeout_in_ms: 2000
# how long a coordinator should continue to retry a CAS operation
# that contends with other proposals for the same row
cas_contention_timeout_in_ms: 1000

# phi value that must be reached for a host to be marked down.
# most users should never need to adjust this.
# phi_convict_threshold: 8

# IEndpointSnitch.  The snitch has two functions:
# - it teaches Scylla enough about your network topology to route
#   requests efficiently
# - it allows Scylla to spread replicas around your cluster to avoid
#   correlated failures. It does this by grouping machines into
#   "datacenters" and "racks."  Scylla will do its best not to have
#   more than one replica on the same "rack" (which may not actually
#   be a physical location)
#
# IF YOU CHANGE THE SNITCH AFTER DATA IS INSERTED INTO THE CLUSTER,
# YOU MUST RUN A FULL REPAIR, SINCE THE SNITCH AFFECTS WHERE REPLICAS
# ARE PLACED.
#
# Out of the box, Scylla provides
#  - SimpleSnitch:
#    Treats Strategy order as proximity. This can improve cache
#    locality when disabling read repair.  Only appropriate for
#    single-datacenter deployments.
#  - GossipingPropertyFileSnitch
#    This should be your go-to snitch for production use.  The rack
#    and datacenter for the local node are defined in
#    cassandra-rackdc.properties and propagated to other nodes via
#    gossip.  If cassandra-topology.properties exists, it is used as a
#    fallback, allowing migration from the PropertyFileSnitch.
#  - PropertyFileSnitch:
#    Proximity is determined by rack and data center, which are
#    explicitly configured in cassandra-topology.properties.
#  - Ec2Snitch:
#    Appropriate for EC2 deployments in a single Region. Loads Region
#    and Availability Zone information from the EC2 API. The Region is
#    treated as the datacenter, and the Availability Zone as the rack.
#    Only private IPs are used, so this will not work across multiple
#    Regions.
#  - Ec2MultiRegionSnitch:
#    Uses public IPs as broadcast_address to allow cross-region
#    connectivity.  (Thus, you should set seed addresses to the public
#    IP as well.) You will need to open the storage_port or
#    ssl_storage_port on the public IP firewall.  (For intra-Region
#    traffic, Scylla will switch to the private IP after
#    establishing a connection.)
#  - RackInferringSnitch:
#    Proximity is determined by rack and data center, which are
#    assumed to correspond to the 3rd and 2nd octet of each node's IP
#    address, respectively.  Unless this happens to match your
#    deployment conventions, this is best used as an example of
#    writing a custom Snitch class and is provided in that spirit.
#
# You can use a custom Snitch by setting this to the full class name
# of the snitch, which will be assumed to be on your classpath.
endpoint_snitch: SimpleSnitch

# The address or interface to bind the Thrift RPC service and native transport
# server to.
#
# Set rpc_address OR rpc_interface, not both. Interfaces must correspond
# to a single address, IP aliasing is not supported.
#
# Leaving rpc_address blank has the same effect as on listen_address
# (i.e. it will be based on the configured hostname of the node).
#
# Note that unlike listen_address, you can specify 0.0.0.0, but you must also
# set broadcast_rpc_address to a value other than 0.0.0.0.
#
# For security reasons, you should not expose this port to the internet.  Firewall it if needed.
#
# If you choose to specify the interface by name and the interface has an ipv4 and an ipv6 address
# you can specify which should be chosen using rpc_interface_prefer_ipv6. If false the first ipv4
# address will be used. If true the first ipv6 address will be used. Defaults to false preferring
# ipv4. If there is only one address it will be selected regardless of ipv4/ipv6.
rpc_address: localhost
# rpc_interface: eth1
# rpc_interface_prefer_ipv6: false

# port for Thrift to listen for clients on
rpc_port: 9160

# port for REST API server
api_port: 10000

# IP for the REST API server
api_address: 127.0.0.1

# Log WARN on any batch size exceeding this value. 128 kiB per batch by default.
# Caution should be taken on increasing the size of this threshold as it can lead to node instability.
batch_size_warn_threshold_in_kb: 128

# Fail any multiple-partition batch exceeding this value. 1 MiB (8x warn threshold) by default.
batch_size_fail_threshold_in_kb: 1024

# Authentication backend, identifying users
# Out of the box, Scylla provides org.apache.cassandra.auth.{AllowAllAuthenticator,
# PasswordAuthenticator}.
#
# - AllowAllAuthenticator performs no checks - set it to disable authentication.
# - PasswordAuthenticator relies on username/password pairs to authenticate
#   users. It keeps usernames and hashed passwords in system_auth.credentials table.
#   Please increase system_auth keyspace replication factor if you use this authenticator.
# - com.scylladb.auth.TransitionalAuthenticator requires username/password pair
#   to authenticate in the same manner as PasswordAuthenticator, but improper credentials
#   result in being logged in as an anonymous user. Use for upgrading clusters' auth.
authenticator: PasswordAuthenticator

# Authorization backend, implementing IAuthorizer; used to limit access/provide permissions
# Out of the box, Scylla provides org.apache.cassandra.auth.{AllowAllAuthorizer,
# CassandraAuthorizer}.
#
# - AllowAllAuthorizer allows any action to any user - set it to disable authorization.
# - CassandraAuthorizer stores permissions in system_auth.permissions table. Please
#   increase system_auth keyspace replication factor if you use this authorizer.
# - com.scylladb.auth.TransitionalAuthorizer wraps around the CassandraAuthorizer, using it for
#   authorizing permission management. Otherwise, it allows all. Use for upgrading
#   clusters' auth.
authorizer: CassandraAuthorizer

# initial_token allows you to specify tokens manually.  While you can use # it with
# vnodes (num_tokens > 1, above) -- in which case you should provide a
# comma-separated list -- it's primarily used when adding nodes # to legacy clusters
# that do not have vnodes enabled.
# initial_token:

# RPC address to broadcast to drivers and other Scylla nodes. This cannot
# be set to 0.0.0.0. If left blank, this will be set to the value of
# rpc_address. If rpc_address is set to 0.0.0.0, broadcast_rpc_address must
# be set.
# broadcast_rpc_address: 1.2.3.4

# Uncomment to enable experimental features
# experimental_features:
#     - udf
#     - alternator-streams
#     - alternator-ttl
#     - raft

# The directory where hints files are stored if hinted handoff is enabled.
# hints_directory: /var/lib/scylla/hints

# The directory where hints files are stored for materialized-view updates
# view_hints_directory: /var/lib/scylla/view_hints

# See https://docs.scylladb.com/architecture/anti-entropy/hinted-handoff
# May either be "true" or "false" to enable globally, or contain a list
# of data centers to enable per-datacenter.
# hinted_handoff_enabled: DC1,DC2
# hinted_handoff_enabled: true

# this defines the maximum amount of time a dead host will have hints
# generated.  After it has been dead this long, new hints for it will not be
# created until it has been seen alive and gone down again.
# max_hint_window_in_ms: 10800000 # 3 hours


# Validity period for permissions cache (fetching permissions can be an
# expensive operation depending on the authorizer, CassandraAuthorizer is
# one example). Defaults to 10000, set to 0 to disable.
# Will be disabled automatically for AllowAllAuthorizer.
# permissions_validity_in_ms: 10000

# Refresh interval for permissions cache (if enabled).
# After this interval, cache entries become eligible for refresh. Upon next
# access, an async reload is scheduled and the old value returned until it
# completes. If permissions_validity_in_ms is non-zero, then this also must have
# a non-zero value. Defaults to 2000. It's recommended to set this value to
# be at least 3 times smaller than the permissions_validity_in_ms.
# permissions_update_interval_in_ms: 2000

# The partitioner is responsible for distributing groups of rows (by
# partition key) across nodes in the cluster.  You should leave this
# alone for new clusters.  The partitioner can NOT be changed without
# reloading all data, so when upgrading you should set this to the
# same partitioner you were already using.
#
# Murmur3Partitioner is currently the only supported partitioner,
#
partitioner: org.apache.cassandra.dht.Murmur3Partitioner

# Total space to use for commitlogs.
#
# If space gets above this value (it will round up to the next nearest
# segment multiple), Scylla will flush every dirty CF in the oldest
# segment and remove it.  So a small total commitlog space will tend
# to cause more flush activity on less-active columnfamilies.
#
# A value of -1 (default) will automatically equate it to the total amount of memory
# available for Scylla.
commitlog_total_space_in_mb: -1

# TCP port, for commands and data
# For security reasons, you should not expose this port to the internet.  Firewall it if needed.
# storage_port: 7000

# SSL port, for encrypted communication.  Unused unless enabled in
# encryption_options
# For security reasons, you should not expose this port to the internet.  Firewall it if needed.
# ssl_storage_port: 7001

# listen_interface: eth0
# listen_interface_prefer_ipv6: false

# Whether to start the native transport server.
# Please note that the address on which the native transport is bound is the
# same as the rpc_address. The port however is different and specified below.
# start_native_transport: true

# The maximum size of allowed frame. Frame (requests) larger than this will
# be rejected as invalid. The default is 256MB.
# native_transport_max_frame_size_in_mb: 256

# Whether to start the thrift rpc server.
# start_rpc: true

# enable or disable keepalive on rpc/native connections
# rpc_keepalive: true

# Set to true to have Scylla create a hard link to each sstable
# flushed or streamed locally in a backups/ subdirectory of the
# keyspace data.  Removing these links is the operator's
# responsibility.
# incremental_backups: false

# Whether or not to take a snapshot before each compaction.  Be
# careful using this option, since Scylla won't clean up the
# snapshots for you.  Mostly useful if you're paranoid when there
# is a data format change.
# snapshot_before_compaction: false

# Whether or not a snapshot is taken of the data before keyspace truncation
# or dropping of column families. The STRONGLY advised default of true
# should be used to provide data safety. If you set this flag to false, you will
# lose data on truncation or drop.
# auto_snapshot: true

# When executing a scan, within or across a partition, we need to keep the
# tombstones seen in memory so we can return them to the coordinator, which
# will use them to make sure other replicas also know about the deleted rows.
# With workloads that generate a lot of tombstones, this can cause performance
# problems and even exaust the server heap.
# (http://www.datastax.com/dev/blog/cassandra-anti-patterns-queues-and-queue-like-datasets)
# Adjust the thresholds here if you understand the dangers and want to
# scan more tombstones anyway.  These thresholds may also be adjusted at runtime
# using the StorageService mbean.
# tombstone_warn_threshold: 1000
# tombstone_failure_threshold: 100000

# Granularity of the collation index of rows within a partition.
# Increase if your rows are large, or if you have a very large
# number of rows per partition.  The competing goals are these:
#   1) a smaller granularity means more index entries are generated
#      and looking up rows withing the partition by collation column
#      is faster
#   2) but, Scylla will keep the collation index in memory for hot
#      rows (as part of the key cache), so a larger granularity means
#      you can cache more hot rows
# column_index_size_in_kb: 64

# Auto-scaling of the promoted index prevents running out of memory
# when the promoted index grows too large (due to partitions with many rows
# vs. too small column_index_size_in_kb).  When the serialized representation
# of the promoted index grows by this threshold, the desired block size
# for this partition (initialized to column_index_size_in_kb)
# is doubled, to decrease the sampling resolution by half.
#
# To disable promoted index auto-scaling, set the threshold to 0.
# column_index_auto_scale_threshold_in_kb: 10240

# Log a warning when writing partitions larger than this value
# compaction_large_partition_warning_threshold_mb: 1000

# Log a warning when writing rows larger than this value
# compaction_large_row_warning_threshold_mb: 10

# Log a warning when writing cells larger than this value
# compaction_large_cell_warning_threshold_mb: 1

# Log a warning when row number is larger than this value
# compaction_rows_count_warning_threshold: 100000

# Log a warning when writing a collection containing more elements than this value
# compaction_collection_elements_count_warning_threshold: 10000

# How long the coordinator should wait for seq or index scans to complete
# range_request_timeout_in_ms: 10000
# How long the coordinator should wait for writes to complete
# counter_write_request_timeout_in_ms: 5000
# How long a coordinator should continue to retry a CAS operation
# that contends with other proposals for the same row
# cas_contention_timeout_in_ms: 1000
# How long the coordinator should wait for truncates to complete
# (This can be much longer, because unless auto_snapshot is disabled
# we need to flush first so we can snapshot before removing the data.)
# truncate_request_timeout_in_ms: 60000
# The default timeout for other, miscellaneous operations
# request_timeout_in_ms: 10000

# Enable or disable inter-node encryption.
# You must also generate keys and provide the appropriate key and trust store locations and passwords.
#
# The available internode options are : all, none, dc, rack
# If set to dc scylla  will encrypt the traffic between the DCs
# If set to rack scylla  will encrypt the traffic between the racks
#
# SSL/TLS algorithm and ciphers used can be controlled by
# the priority_string parameter. Info on priority string
# syntax and values is available at:
#   https://gnutls.org/manual/html_node/Priority-Strings.html
#
# The require_client_auth parameter allows you to
# restrict access to service based on certificate
# validation. Client must provide a certificate
# accepted by the used trust store to connect.
#
# server_encryption_options:
#    internode_encryption: none
#    certificate: conf/scylla.crt
#    keyfile: conf/scylla.key
#    truststore: <not set, use system trust>
#    certficate_revocation_list: <not set>
#    require_client_auth: False
#    priority_string: <not set, use default>

# enable or disable client/server encryption.
# client_encryption_options:
#    enabled: false
#    certificate: conf/scylla.crt
#    keyfile: conf/scylla.key
#    truststore: <not set, use system trust>
#    certficate_revocation_list: <not set>
#    require_client_auth: False
#    priority_string: <not set, use default>

# internode_compression controls whether traffic between nodes is
# compressed.
# can be:  all  - all traffic is compressed
#          dc   - traffic between different datacenters is compressed
#          none - nothing is compressed.
# internode_compression: none

# Enable or disable tcp_nodelay for inter-dc communication.
# Disabling it will result in larger (but fewer) network packets being sent,
# reducing overhead from the TCP protocol itself, at the cost of increasing
# latency if you block for cross-datacenter responses.
# inter_dc_tcp_nodelay: false

# Relaxation of environment checks.
#
# Scylla places certain requirements on its environment.  If these requirements are
# not met, performance and reliability can be degraded.
#
# These requirements include:
#    - A filesystem with good support for aysnchronous I/O (AIO). Currently,
#      this means XFS.
#
# false: strict environment checks are in place; do not start if they are not met.
# true: relaxed environment checks; performance and reliability may degraade.
#
developer_mode: false


# Idle-time background processing
#
# Scylla can perform certain jobs in the background while the system is otherwise idle,
# freeing processor resources when there is other work to be done.
#
# defragment_memory_on_idle: true
#
# prometheus port
# By default, Scylla opens prometheus API port on port 9180
# setting the port to 0 will disable the prometheus API.
# prometheus_port: 9180
#
# prometheus address
# Leaving this blank will set it to the same value as listen_address.
# This means that by default, Scylla listens to the prometheus API on the same
# listening address (and therefore network interface) used to listen for
# internal communication. If the monitoring node is not in this internal
# network, you can override prometheus_address explicitly - e.g., setting
# it to 0.0.0.0 to listen on all interfaces.
# prometheus_address: 1.2.3.4

# Distribution of data among cores (shards) within a node
#
# Scylla distributes data within a node among shards, using a round-robin
# strategy:
#  [shard0] [shard1] ... [shardN-1] [shard0] [shard1] ... [shardN-1] ...
#
# Scylla versions 1.6 and below used just one repetition of the pattern;
# this intefered with data placement among nodes (vnodes).
#
# Scylla versions 1.7 and above use 4096 repetitions of the pattern; this
# provides for better data distribution.
#
# the value below is log (base 2) of the number of repetitions.
#
# Set to 0 to avoid rewriting all data when upgrading from Scylla 1.6 and
# below.
#
# Keep at 12 for new clusters.
murmur3_partitioner_ignore_msb_bits: 12

# Bypass in-memory data cache (the row cache) when performing reversed queries.
# reversed_reads_auto_bypass_cache: false

# Use a new optimized algorithm for performing reversed reads.
# Set to `false` to fall-back to the old algorithm.
# enable_optimized_reversed_reads: true

# Use on a new, parallel algorithm for performing aggregate queries.
# Set to `false` to fall-back to the old algorithm.
# enable_parallelized_aggregation: true

# When enabled, the node will start using separate commit log for schema changes
# right from the boot. Without this, it only happens following a restart after
# all nodes in the cluster were upgraded.
#
# Having this option ensures that new installations don't need a rolling restart
# to use the feature, but upgrades do.
#
# WARNING: It's unsafe to set this to false if the node previously booted
# with the schema commit log enabled. In such case, some schema changes
# may be lost if the node was not cleanly stopped.
force_schema_commit_log: true
ECK
Deploy ECK
The Elasticsearch deployment process will be summarized in this guide. However, admins may want to consult the official ECK documentation for a more complete explanation of different configuration options and additional troubleshooting steps. The Elasticsearch deployment guide can be found here.
Thorium requires Elasticsearch to enable full-text search of analysis tool results and other
submission data. Kibana may optionally be deployed as a web interface for managing the ECK
configuration such as user roles, permissions and storage indexes.
1) Deploy Elastic Operator and CRDs
Please consult the supported versions of the
Elastic Cloud on Kubernetesdocumentation to ensure the operator supports the Kubernetes version of your environment as well as the Elasticsearch and Kibana version you will be deploying.
Create an Elasticsearch operator and the related CRDs. It may be necessary to update the following
command with the latest operator and CRD version. Note that the shared operator/crd version will
differ from the Elasticsearch and Kibana version.
kubectl apply -f https://download.elastic.co/downloads/eck/2.16.1/crds.yaml
kubectl create -f https://download.elastic.co/downloads/eck/2.16.1/operator.yaml
2) Update System Configuration
The system configuration of K8s cluster nodes may need to be updated to meet the resource requirements
of ECK. In particular the maximum allowed virtual memory maps for an individual process must be increased
for elastic pods to successfully start. This configuration value may be added to a linux system’s
/etc/sysctl.conf or /etc/sysctl.d/99-sysctl.conf file. Be aware that some linux versions ignore the
/etc/sysctl.conf file on boot.
echo "vm.max_map_count=262144" >> /etc/sysctl.d/99-sysctl.conf
System configuration options for elastic nodes can be found here. You can also set an initContainer to run before elastic starts that will set the max_map_count. That option is what the next step will show.
3) Deploy Kibana and ElasticSearch
You may want to update these fields in the following resource files before applying them with kubectl:
version- version of ES and Kibana you want to deploycount- number of nodes in your ES cluster or kibana replicasstorageClassName- name of the storage provisioner for requesting K8s PVCsresources.requests.storage- size of storage volumes for each ES podresources.[requests,limits].memory- memory for each ES and Kibana podresources.[requests,limits].cpu- cpu for each ES and Kibana pod
Deploy Elastic
cat <<EOF | kubectl apply -f -
apiVersion: elasticsearch.k8s.elastic.co/v1
kind: Elasticsearch
metadata:
  name: elastic
  namespace: elastic-system
spec:
  version: 8.17.2
  volumeClaimDeletePolicy: DeleteOnScaledownOnly
  nodeSets:
  - name: default
    count: 3
    podTemplate:
      spec:
        initContainers:
        - name: sysctl
          securityContext:
            privileged: true
            runAsUser: 0
          command: ['sh', '-c', 'sysctl -w vm.max_map_count=262144']
        containers:
        - name: elasticsearch
          env:
          - name: ES_JAVA_OPTS
            value: -Xms28g -Xmx28g
          resources:
            requests:
              memory: 32Gi
              cpu: 4
            limits:
              memory: 32Gi
              cpu: 4
    volumeClaimTemplates:
      - metadata:
          name: elasticsearch-data
        spec:
          storageClassName: csi-rbd-sc
          accessModes:
          - ReadWriteOnce
          resources:
            requests:
              storage: 12Ti
    config:
      node.store.allow_mmap: true
      http.max_content_length: 1024mb
EOF
Deploy Kibana
cat <<EOF | kubectl apply -f -
apiVersion: kibana.k8s.elastic.co/v1
kind: Kibana
metadata:
  name: elastic
  namespace: elastic-system
spec:
  version: 8.17.2
  count: 1
  elasticsearchRef:
    name: elastic
EOF
4) Verify Elastic and Kibana are up
Ensure the Elastic and Kibana pods are Running.
kubectl get pods -n elastic-system
# NAME                          READY   STATUS    RESTARTS       AGE
# elastic-es-default-0          1/1     Running   0              1h
# elastic-es-default-1          1/1     Running   0              1h
# elastic-es-default-2          1/1     Running   0              1h
# elastic-kb-55f49bdfb4-p6kg9   1/1     Running   0              1h
# elastic-operator-0            1/1     Running   0              1h
5) Create Thorium role and index
Create the Elastic thorium user, role, and results index using the following command. Be sure to update the
INSECURE_ES_PASSWORD to an appropriately secure value. The text block can be edited before copy-pasting
the command into a terminal.
You will use the username, password, and index name configured here when you create the ThoriumCluster resource.
export ESPASS=$(kubectl get secret -n elastic-system elastic-es-elastic-user -o=jsonpath='{.data.elastic}' | base64 --decode; echo)
kubectl -n elastic-system exec -i --tty=false pod/elastic-es-default-0 -- /bin/bash << EOF
# Create thorium role
curl -k -X PUT -u elastic:$ESPASS "https://localhost:9200/thorium?pretty"
# Create results index and give thorium role privileges
curl -k -X POST -u elastic:$ESPASS "https://localhost:9200/_security/role/thorium?pretty" -H 'Content-Type: application/json' -d'
{
  "indices": [
    {
      "names": ["results"],
      "privileges": ["all"]
    }
  ]
}
'
# Create thorium user with thorium role
curl -k -X POST -u elastic:$ESPASS "https://localhost:9200/_security/user/thorium?pretty" -H 'Content-Type: application/json' -d'
{
  "password" : "INSECURE_ES_PASSWORD",
  "roles" : ["thorium"],
  "full_name" : "Thorium",
  "email" : "thorium@sandia.gov"
}
'
EOF
Tracing
Deploy Tracing (Jaeger + Quickwit)
1) Deploy Postgres DB (using Kubegres)
Quickwit will need a Postgres database to store metadata. This guide uses the Kubegres operator to deploy a distributed instance of Postgres. Using Kubegres is optional, any Postgres deployment method may be used included external (to K8s) options.
Deploy Kubegres CRD and operator
kubectl apply -f https://raw.githubusercontent.com/reactive-tech/kubegres/refs/tags/v1.19/kubegres.yaml
kubectl rollout status --watch --timeout=600s deployment.apps/kubegres-controller-manager -n kubegres-system
Create PostgresDB user password secrets
Update SUPER_USER_PASSWORD and REPLICATION_PASSWORD with secure values and save those to
put in the Quickwit helm values YAML file later in this guide.
kubectl create ns quickwit
cat <<EOF | kubectl apply -f -
apiVersion: v1
kind: Secret
metadata:
  name: postgres-cluster-auth
  namespace: quickwit
type: Opaque
stringData:
  superUserPassword: <SUPER_USER_PASSWORD>
  replicationUserPassword: <REPLICATION_PASSWORD>
EOF
Create a Kubegres postgres DB
Use the following command to deploy a Postgres cluster using Kubegres. It may be necessary to edit
the DB size, Postgres version, and storageClassName depending on the deployment environment.
cat <<EOF | kubectl apply -f -
apiVersion: kubegres.reactive-tech.io/v1
kind: Kubegres
metadata:
  name: postgres
  namespace: quickwit
spec:
   replicas: 3
   image: docker.io/postgres:17
   database:
      storageClassName: csi-rbd-sc
      size: 4Ti
   env:
      - name: POSTGRES_PASSWORD
        valueFrom:
           secretKeyRef:
              name: postgres-cluster-auth
              key: superUserPassword
      - name: POSTGRES_REPLICATION_PASSWORD
        valueFrom:
           secretKeyRef:
              name: postgres-cluster-auth
              key: replicationUserPassword
EOF
Set password for Postgres Quickwit user role
After Kubegres has completed deployment of Postgres, create a Quickwit Postgres user role using the
following command. Before running the command, update INSECURE_QUICKWIT_PASSWORD to a secure value.
kubectl rollout status --watch --timeout=600s statefulset/postgres-1 -n quickwit
kubectl -n quickwit exec -it pod/postgres-1-0 -- /bin/bash -c "PGPASSWORD=INSECURE_QUICKWIT_PASSWORD su postgres -c \"createdb quickwit-metastore\""
4) Deploy Quickwit
Add the Quickwit Helm repo
helm repo add quickwit https://helm.quickwit.io
helm repo update quickwit
Create a Quickwit Helm values config: quickwit-values.yml
Update the POSTGRES_PASSWORD, ACCESS_ID, and SECRET_KEY values before deploying Quickwit.
For non-rook deployments, the endpoint may also need to be updated to point at the correct S3
endpoint. Edit the hostname om QW_METASTORE_URI for Postgres instances that were not setup using
Kubegres.
image:
  repository: docker.io/quickwit/quickwit
  pullPolicy: IfNotPresent
  # Overrides the image tag whose default is the chart appVersion.
  #tag: v0.6.4
metastore:
  replicaCount: 1
  # Extra env for metastore
  extraEnv:
    QW_METASTORE_URI: "postgres://postgres:<POSTGRES_PASSWORD>@postgres.quickwit.svc.cluster.local:5432/quickwit-metastore"
config:
  default_index_root_uri: s3://quickwit/quickwit-indexes
  storage:
    s3:
      flavor: minio
      region: default
      endpoint: http://rook-ceph-rgw-thorium-s3-store.rook-ceph.svc.cluster.local
      force_path_style_access: true
      access_key_id: "<ACCESS_ID>"
      secret_access_key: "<SECRET_KEY>"
Now use that values file to install Quickwit
helm install quickwit quickwit/quickwit -n quickwit -f quickwit-values.yml
Verify Quickwit pods are all running
kubectl get pods -n quickwit
# NAME                                      READY   STATUS    RESTARTS   AGE
# postgres-2-0                              1/1     Running   0          1h
# postgres-3-0                              1/1     Running   0          1h
# postgres-4-0                              1/1     Running   0          1h
# quickwit-control-plane-HASH               1/1     Running   0          1h
# quickwit-indexer-0                        1/1     Running   0          1h
# quickwit-janitor-HASH                     1/1     Running   0          1h
# quickwit-metastore-HASH                   1/1     Running   0          1h
# quickwit-searcher-0                       1/1     Running   0          1h
# quickwit-searcher-1                       1/1     Running   0          1h
# quickwit-searcher-2                       1/1     Running   0          1h
5) Deploy Jaeger
Create a namespace for Jaeger
kubectl create ns jaeger
Create the Jaeger Statefulset
cat <<EOF | kubectl apply -f -
apiVersion: apps/v1
kind: StatefulSet
metadata:
  name: jaeger
  namespace: jaeger
  labels:
    app: jaeger
spec:
  serviceName: jaeger
  replicas: 1
  selector:
    matchLabels:
      app: jaeger
  template:
    metadata:
      labels:
          app: jaeger
    spec:
      containers:
        - name: jaeger
          image: jaegertracing/jaeger-query:latest
          imagePullPolicy: Always
          env:
            - name: SPAN_STORAGE_TYPE
              value: "grpc"
            - name: GRPC_STORAGE_SERVER
              value: "quickwit-searcher.quickwit.svc.cluster.local:7281"
          resources:
            requests:
              memory: "8Gi"
              cpu: "2"
            limits:
              memory: "8Gi"
              cpu: "2"
EOF
Create the Jaeger service
cat <<EOF | kubectl apply -f -
apiVersion: v1
kind: Service
metadata:
  name: jaeger
  namespace: jaeger
spec:
  type: ClusterIP
  selector:
    app: jaeger
  ports:
  - name: jaeger
    port: 16686
    targetPort: 16686
EOF
Verify the Jaeger pod is running
kubectl get pods -n jaeger
# NAME       READY   STATUS    RESTARTS   AGE
# jaeger-0   1/1     Running   0          1h
Thorium
Deploy Thorium
1) Deploy Thorium Operator
Create Thorium ServiceAccount and RBAC
The Thorium operator and scaler can be configured to use a service account with the ability to modify K8s resources. This is the default configuration for single K8s cluster Thorium deployments.
Start by creating a namespace for all Thorium resources.
kubectl create ns thorium
Create a Thorium ServiceAccount and roles
cat <<EOF | kubectl apply -f -
apiVersion: v1
kind: ServiceAccount
metadata:
  name: thorium
  namespace: thorium
imagePullSecrets:
  - name: registry-token
automountServiceAccountToken: true
---

apiVersion: v1
kind: Secret
metadata:
  name: thorium-account-token
  namespace: thorium
  annotations:
    kubernetes.io/service-account.name: thorium
type: kubernetes.io/service-account-token
---

apiVersion: rbac.authorization.k8s.io/v1
kind: ClusterRole
metadata:
  # "namespace" omitted since ClusterRoles are not namespaced
  name: thorium-operator
rules:
### https://kubernetes.io/docs/reference/kubectl/#resource-types
### create custom resources
- apiGroups: ["apiextensions.k8s.io"]
  resources: ["customresourcedefinitions"]
  verbs: ["get", "list", "watch", "create", "update", "patch", "delete"]
### any custom resources under the sandia.gov group
- apiGroups: ["sandia.gov"]
  resources: ["*"]
  verbs: ["*"]
### deployments
- apiGroups: ["apps"]
  resources: ["deployments"]
  verbs: ["get", "list", "watch", "create", "update", "patch", "delete"]
### networking
- apiGroups: ["networking.k8s.io"]
  resources: ["networkpolicies"]
  verbs: ["get", "list", "watch", "create", "update", "patch", "delete"]
### events
- apiGroups: ["events.k8s.io"]
  resources: ["events"]
  verbs: ["get", "list", "watch", "create", "update", "patch", "delete"]
### v1 API resources
- apiGroups: [""]
  resources: ["pods", "services", "secrets", "configmaps", "nodes", "namespaces", "events"]
  verbs: ["get", "list", "watch", "create", "update", "patch", "delete"]
---

apiVersion: rbac.authorization.k8s.io/v1
kind: ClusterRoleBinding
metadata:
  name: thorium-operator-binding
subjects:
- kind: ServiceAccount
  name: thorium
  namespace: thorium
  #apiGroup: "rbac.authorization.k8s.io"
roleRef:
  kind: ClusterRole
  name: thorium-operator
  apiGroup: "rbac.authorization.k8s.io"
EOF
Create a registry pull secret (optional)
Create a registry token that will enable pulling the Thorium container image from the registry.
kubectl create secret generic operator-registry-token --namespace="thorium" --type=kubernetes.io/dockerconfigjson --from-file=".dockerconfigjson"
Here is an example of a .dockerconfigjson file. Replace the fields wrapped by <> with registry values.
{
	"auths": {
		"<REGISTRY.DOMAIN>": {
			"auth": "<base64 of username:password>"
		}
	}
}
Create the Thorium Operator
Update the image field with the correct registry path and tag for the Thorium container image.
cat <<EOF | kubectl apply -f -
apiVersion: apps/v1
kind: Deployment
metadata:
  name: operator
  namespace: thorium
  labels:
    app: operator
spec:
  replicas: 1
  selector:
    matchLabels:
      app: operator
  template:
    metadata:
      labels:
          app: operator
    spec:
      serviceAccountName: thorium
      automountServiceAccountToken: true
      containers:
        - name: operator
          image: "<REGISTRY.DOMAIN/path/to/image/thorium:tag>"
          imagePullPolicy: Always
          resources:
            requests:
              memory: "1Gi"
              cpu: 1
            limits:
              memory: "1Gi"
              cpu: 1
          env:
            - name: "noproxy"
            - name: "http_proxy"
            - name: "https_proxy"
            - name: "NOPROXY"
            - name: "HTTP_PROXY"
            - name: "HTTPS_PROXY"
      imagePullSecrets:
        - name: operator-registry-token
EOF
Verify the operator has successfully started
kubectl rollout status --watch --timeout=600s deployment.apps/operator -n thorium
4) Create a Thorium banner ConfigMap
Create a text file called banner.txt that contains a banner message. This message will be displayed
when users login into the Thorium web interface.
kubectl create cm banner --from-file=/path/to/banner.txt -n thorium
5) Create a ThoriumCluster resource
The ThoriumCluster CRD defines database client access, Thorium cluster nodes, and much more. Enter all the passwords, DB/S3 endpoints, and Thorium container image path/tag into this file. The operator will use this the CRD to deploy a working Thorium instance. If this resource definition is updated after the initial deployment the operator will role those changes out and restart Thorium components such as the scaler and API.
Create a thorium-cluster.yml file and update the example values:
apiVersion: sandia.gov/v1
kind: ThoriumCluster
metadata:
  name: prod
  namespace: thorium
spec:
  registry: "<REGISTRY.DOMAIN/path/to/image/thorium>"
  version: "<IMAGE TAG>"
  image_pull_policy: Always
  components:
    api:
      replicas: 1
      urls:
      - "<THORIUM FQDN>"
      ports:
      - 80
      - 443
    scaler:
      service_account: true
    baremetal_scaler: {}
    search_streamer: {}
    event_handler: {}
  config:
    thorium:
      secret_key: "<SECRET>"
      tracing:
        external:
          Grpc:
            endpoint: "http://quickwit-indexer.quickwit.svc.cluster.local:7281"
            level: "Info"
        local:
          level: "Info"
      files:
        bucket: "thorium-files"
        password: "SecretCornIsBest"
        earliest: 1610596807
      results:
        bucket: "thorium-result-files"
        earliest: 1610596807
      attachments:
        bucket: "thorium-comment-files"
      repos:
        bucket: "thorium-repo-files"
      ephemeral:
        bucket: "thorium-ephemeral-files"
      s3:
        access_key: "<KEY>"
        secret_token: "<TOKEN>"
        endpoint: "https://<S3 FQDN>"
      auth:
        local_user_ids:
          group: 1879048192
          user: 1879048192
        token_expire: 90
      scaler:
        crane:
          insecure: true
        k8s:
          clusters:
            kubernetes-admin@cluster.local:
              alias: "production"
              nodes:
                - "<K8s host 1>"
                - "<K8s host 2>"
                - "<K8s host 3>"
                - "<K8s host 4>"
                - "<K8s host 5>"
    redis:
      host: "redis.redis.svc.cluster.local"
      port: 6379
      password: "<PASSWORD>"
    scylla:
      nodes:
	- <SCYLLA IP 1>
	- <SCYLLA IP 2>
	- <SCYLLA IP 3>
      replication: 3
      auth:
        username: "thorium"
        password: "<PASSWORD>"
    elastic:
      node: "https://elastic-es-http.elastic-system.svc.cluster.local:9200"
      username: "thorium"
      password: "<PASSWORD>"
      results: "results"
  registry_auth:
    <REGISTRY.DOMAIN: <base64 USERNAME:PASSWORD>
    <REGISTRY2.DOMAIN: <base64 USERNAME:PASSWORD>
Thorium deployments that consist of multiple K8s clusters (managed by a single scaler pod) will
require a dedicated kubeconfig secret rather than the use of a service account that is default
for single cluster instances. This secret file must be built manually from the kubeconfig files
of the Thorium clusters that will be managed. The service_account field in the ThoriumCluster
CRD will be set to false for multi-cluster Thorium deployments. Most Thorium deployments will
are not multi-cluster.
Create the ThoriumCluster resource:
The operator will attempt to deploy the ThoriumCluster from the CRD you applied. This will include
creating secrets such as the shared thorium config (thorium.yml). It will also deploy scaler,
api, event-handler, and search-streamer pods if those have been been specified.
# create the thorium CRD
kubectl create -f thorium-cluster-<DEPLOYMENT>.yml
6) Create IngressRoutes
IngressRoutes will be needed to direct web traffic to the Thorium API through the Traefik ingress
proxy. Modify the following command with the correct THORIUM.DOMAIN FQDN. A TLS certificate
called api-certs will be required. Without that K8s secret, Traefik will serve a default
self-signed cert that web clients will flag as insecure.
Create TLS K8s secret
Once you have signed tls.crt and tls.key files, create the api-certs secret using kubectl.
kubectl create secret tls api-certs --namespace="thorium" --key="tls.key" --cert="tls.crt"
Create Traefik IngressRoutes and Middleware
apiVersion: traefik.io/v1alpha1
kind: TLSStore
metadata:
  name: default
  namespace: thorium
spec:
  defaultCertificate:
    secretName: api-certs
---

apiVersion: traefik.io/v1alpha1
kind: Middleware
metadata:
  name: ui-prefix-prepend
spec:
  addPrefix:
    prefix: /ui
---

apiVersion: traefik.io/v1alpha1
kind: IngressRoute
metadata:
  name: thorium-ingress
spec:
  entryPoints:
    - websecure
  routes:
  - match: "Host(`THORIUM.DOMAIN`) && PathPrefix(`/api`)"
    kind: Rule
    services:
    - name: thorium-api
      port: 80
  - match: "Host(`THORIUM.DOMAIN`) && PathPrefix(`/assets`)"
    kind: Rule
    services:
    - name: thorium-api
      port: 80
  - match: "Host(`THORIUM.DOMAIN) && PathPrefix(`/ui`)"
    kind: Rule
    services:
    - name: thorium-api
      port: 80
  - match: "Host(`THORIUM.DOMAIN`)"
    kind: Rule
    services:
    - name: thorium-api
      port: 80
    middlewares:
      - name: ui-prefix-prepend
  tls:
    secretName: api-certs
Operations
This section details common operations that an admin would conduct on their Thorium deployment. This includes:
Troubleshooting Web UI Issues
It can be difficult to troubleshoot a user’s Web UI issues without having access to that user’s browser session. To help with this problem, the Thorium Web UI supports an admin-only feature allowing for masquerading as a different user.
To masquerade as a user, navigate to the users page in the Web UI using the left hand navigation bar (https://<URL>/users).
Then scroll to the username of who reported the issue and click the masquerade button on the right side of the users name, role, and group membership.

A modal will pop up asking to confirm that you want to logout of your current session and into a session for that user.
Don’t forget to logout from your masquerade session when you are done troubleshooting.
Delete a Group
Any group owner or Thorium admin can delete a group. It is important to remember that groups are the resource owners rather than the users that created those resources. Files, repositories, images, pipelines, tool results, and file comments can all be owned by groups. If you delete a group, some of these resources will automatically be purged by the API. For performance reasons, some resources will not be cleaned up when the API services a group deletion request. The following table indicates which resources are cleaned up automatically:
| Group Resources | Removed Upon Group Deletion |
|---|---|
| Files | No |
| File Comments | No |
| Images | Yes |
| Pipelines | Yes |
| Tool Results | No |
| Reactions | Yes |
| Reaction Stage Logs | No, aged out automatically |
| Repositories | No |
Archiving Groups Instead
Generally we recommend archiving rather than deleting groups. You can do this by adding the Thorium system user to the group as an owner (since groups must have atleast 1 owner) and then removing non-admin group members. This preserves data and analysis artifacts without orphaning data and and mitigates the risk of future data leakage if that group name was reused by another team.
Preparing For Group Deletion
If you do want to delete a group, you will need to manually delete any files, repositories, tool results, and file comments using the Web UI, Thorctl, or direct API requests. The following support table details what interfaces support deleting resources:
| Group Resources | Thorctl Deletion | Web UI Deletion | API Deletion Route |
|---|---|---|---|
| Files | Yes | Yes | Yes |
| File Comments | No | No | No, support planned |
| Images | No | Yes | Yes |
| Pipelines | No | Yes | Yes |
| Tool Results | No | No | Yes |
| Reactions | Yes | Yes | Yes |
| Reaction Stage Logs | No | Yes, delete reaction | Yes |
| Repositories | No | No | Yes |
Manually Deleting Files
When you request to delete a file, you are deleting a file submission from a database. A file can have many different submissions from one or more groups. Therefore, a file will only be deleted from the backend object store when the last submission for a file is deleted. This means that a file can be safely “deleted” from one group without removing that file from other groups.
File submissions can be deleted in Thorctl, the Web UI, or through direct API requests. When using Thorctl to delete files in bulk it is important to specify a group to limit the deletion operation to using the -g flag. You must also use the --force flag when not limiting the deletion to a specific target sha256/tag, because this is considered an especially dangerous operation.
DANGER: always specify a group using the -g flag, otherwise you may delete files indiscriminately.
$ thorctl files delete -g demo-group1234 --force
SHA256                                                           | SUBMISSION
-----------------------------------------------------------------+--------------------------------------
3d95783f81e84591dfe8a412c8cec2f5cfcbcbc45ede845bd72b32469e16a34b | 49e8a48b-8ba6-427c-96a9-02a4a9e5ff78 |
...
Delete a User
Only admins can delete the Thorium accounts of users. To delete a user’s account, navigate to the users page in the Web UI using the left hand navigation bar (https://<URL>/users).
Scroll to the Thorium user you want to delete. You will see a delete button to the right side of the users name, role, and group membership. Click the delete button.

You will see a confirmation modal appear after clicking delete. Confirm that you selected the correct user to delete.

Ban Things in Thorium
This is documentation for Thorium admins looking to create bans. For general information on bans and ban types in Thorium, see Bans.
Although bans are often manually generated by the Thorium API and Scaler, Thorium admins can also manually ban entities to prevent users from using them.
Adding a Ban
You can create a ban with Thorctl by using the entity’s respective subcommand and invoking their
bans create function.
thorctl <images/pipelines> bans create <group> <image/pipeline> --msg <MESSAGE>
This will create a Generic-type ban containing the given message. This also generates an Error
level notification associated with the entity that users can view to see the reason for the ban.
The notification is tied to the ban and will be automatically deleted when the ban is removed.
Removing a Ban
Because Generic-type bans are created manually, they must be removed manually as well. You’ll
need the ban’s ID if you want to remove a ban. You can view an entity’s bans and their id’s along
with other metadata by using the Thorctl describe command:
thorctl <ENTITY-TYPE> describe <ENTITY-NAME>
This will output the entity’s data in JSON format, including its bans:
{
    ...
    "bans": {
        "bfe49500-dfcb-4790-a6b3-379114222426": {
            "id": "bfe49500-dfcb-4790-a6b3-379114222426",
            "time_banned": "2024-10-31T22:31:59.251188Z",
            "ban_kind": {
                "Generic": {
                    "msg": "This is an example ban"
                }
            }
        }
    }
}
Take note of the ban’s ID and provide it to the bans delete command to remove it:
thorctl <ENTITY-TYPE> bans delete <BAN-ID>
Note that removing automatically generated bans is not generally advised, as Thorium will eventually re-ban the entity automatically unless the underlying issue is resolved.
Create Notifications
This is documentation for Thorium admins looking to manually create notifications. For general information on notifications in Thorium, see Notifications.
Thorium Notifications are usually generated automatically by the Thorium system to communicate important information to users – for example, that their image or pipeline is banned –, but they can also be created by Thorium admins manually. This gives admins a mechanism to easily alert users who use/develop a particular Thorium entity.
Creating a Notification
You can add a notification to an entity with Thorctl by using the entity’s respective subcommand and invoking their
notifications create function.
thorctl <ENTITY-TYPE> notifications create <group> <ENTITY-NAME> --msg <MESSAGE>
Notification Level
By default, the added notificaion will have the INFO level, but you can manually specify the level as well:
... notifications create --level <info/warn/error>
Tying to an Existing Ban
If you want to tie the notification to a particular ban, you can provide the ban’s ID. Tying a notification to a ban will set it to be automatically deleted when the ban is removed.
... notifications create ... --ban-id <BAN_ID>
Expiration Behavior
By default, notifications at the ERROR level will never “expire” (be deleted automatically), while those on the
WARN and INFO levels will expire according to the retention settings in the Thorium cluster config (in 7 days
by default). You can set whether notification should automatically expire with the --expire flag:
... notifications create ... --expire <true/false>
Deleting a Notification
To remove a notification, you’ll need to know its ID. You can view notifications’ ID’s by using the
--ids/-i flag with notifications get:
thorctl <ENTITY-TYPE> notifications get -ids <group> <ENTITY-NAME>
This will print the notification ID’s along with their contents. Take note of a notification’s ID,
then provide it to notifications delete to delete it:
thorctl <ENTITY-TYPE> notifications delete <ID>
Setting Up KVM VMs for Thorium Reactor
This guide explains how to properly configure KVM virtual machines for the Thorium reactor to manage and use as golden images.
Overview
The Thorium reactor manages KVM-based virtual machines for running analysis jobs. To use this functionality, administrators must pre-configure VMs that the reactor can discover and manage.
Prerequisites
- Libvirt/KVM installed and running
virshcommand-line tool available- Appropriate VM disk images (QCOW2 format recommended)
- Basic understanding of libvirt domain management
2. Golden Snapshot
Each VM must have a snapshot named “golden” that represents a clean, ready-to-use state:
virsh snapshot-create-as thorium_windows_win10 golden
3. QEMU Guest Agent
All VMs for the Thorium reactor must have the QEMU guest agent installed and configured to run at startup so the reactor can transfer and launch the Thorium agent. Be sure to include this in your XML:
    <channel type='unix'>
      <target type='virtio' name='org.qemu.guest_agent.0' />
      <address type='virtio-serial' controller='0' bus='0' port='1' />
    </channel>
4. Agent Requirements
The VM should have:
- Network connectivity to the Thorium cluster
- Any required analysis tools pre-installed
Setup Process
Step 1: Prepare Your VM Disk Image
Create or obtain a QCOW2 disk image with your desired OS
Step 2: Find/Create a Template Domain XML Configuration
Create an XML file with your VM configuration. The file type should be qcow2:
    <disk type='file' device='disk'>
      <driver name='qemu' type='qcow2' />
      <source file='<YOUR-FILE-HERE>' />
      <target dev='vda' bus='virtio' />
      <address type='pci' domain='0x0000' bus='0x03' slot='0x00' function='0x0' />
    </disk>
Be sure to include a virtio-serial channel for the QEMU guest agent:
    <channel type='unix'>
      <target type='virtio' name='org.qemu.guest_agent.0' />
      <address type='virtio-serial' controller='0' bus='0' port='1' />
    </channel>
And VNC is probably helpful as well:
    <memballoon model='virtio'>
      <address type='pci' domain='0x0000' bus='0x05' slot='0x00' function='0x0'/>
    </memballoon>
Step 3: Define the Domain
virsh define /path/to/your/xml.xml
Step 4: Start and Configure the VM
- Start the VM:
virsh start thorium_<GROUP>_<IMAGE>
-
Connect to the VM (using VNC or console) and:
- Install the operating system
- Install virtio drivers and the QEMU guest agent
- Enable the QEMU guest agent to run at startup
- Install any required analysis tools/scripts
-
Shut down the VM cleanly:
Through ACPI:
virsh shutdown thorium_<GROUP>_<IMAGE>
Or manually with VNC, console, or SSH.
Step 5: Copy to a Read-only Golden Image
Now that your image is ready, you should copy it to a new file to serve as your golden image.
qemu-img convert -O qcow2 <IMAGE>.qcow2 <GOLDEN_IMAGE>.qcow2
Step 6: Create a Golden Template XML
Replace hard-coded values for name, CPU, memory, and file with placeholders for Thorium to dynamically update. If you dump the configuration with virsh dumpxml, be sure to remove any domain-specific details like MAC addresses, IP addresses, etc.
<domain type='kvm'>
  <name>{NAME}<GROUP>_<IMAGE></name>
  <vcpu placement='static'>{CPU}</vcpu>
  <memory unit='MiB'>{MEMORY}</memory>
  ...
  <devices>
    <emulator>/usr/bin/qemu-system-x86_64</emulator>
    <disk type='file' device='disk'>
      <driver name='qemu' type='qcow2'/>
      <source file=<'{FILE}'>/>
  ...
Step 7: Move the Golden Image and XML to the final location
Place the golden image and XML together in a directory structured <GOLDEN_BASE>/<GROUP>/<IMAGE>, like
so:
# for image "test" in group "corn" the files should look something like this
find /base/golden
/base/golden/corn/test/test.qcow2
/base/golden/corn/test/test.xml
How the Reactor Manages VMs
Discovery Process
- The reactor connects to libvirt using the socket specified in its configuration (default:
qemu:///system) - During its check cycle, it lists all domains (VMs) from libvirt
- It identifies Thorium-managed VMs by the naming pattern
thorium_* - It attempts to query for the Thorium agent’s status using the QEMU guest agent to manage the VMs’ lifecycle
Launch Process
- Find Available VM: The reactor searches the golden directory for a disk image and XML matching the requested group/image
- Convert to Worker: The reactor:
- Creates a sparse overlay file from the golden image
- Reads the XML file, replacing placeholders with Thorium image configuration values
- Defines the VM with the modified XML
- Starts the VM
- Launch Agent: Uses the QEMU guest agent to transfer and launch the Thorium agent
- Monitor: Tracks the VM’s status and manages its lifecycle
Storage Considerations
Golden Image/XML Location
Specify --golden-dir to direct the reactor to where your golden images are stored.
If not set, the default is based on the set --base_dir, i.e. BASE_DIR/golden.
The structure should be like so:
# for image "test" in group "corn" the files should look something like this
find /base/golden
/base/golden/corn/test/test.qcow2
/base/golden/corn/test/test.xml
Temporary Files
The reactor creates temporary files in the location specified by the --temp-dir argument.
If not set, the default is based on the set --base_dir, i.e. BASE_DIR/tmp. The
temp directory contains overlay qcow2 files for running domains. These are automatically
cleaned up when the domains are shut down.
Troubleshooting
VM Not Being Discovered
- Check Naming: Ensure the VM name follows
thorium_{group}_{image}pattern - Verify Libvirt Connection: Check the reactor’s libvirt socket configuration
- List All Domains:
virsh list --all
QEMU Guest Agent Problems
- The reactor requires the image has the QEMU guest agent installed and properly set up. Check if it’s installed.
Permission Issues
- Check libvirt group membership:
usermod -a -G libvirt thorium-user
- Verify QCOW2 file permissions
Resource Allocation Strategy
CPU Allocation
The reactor converts millicpu (mCPU) requests to vCPU using round-up logic:
- Formula:
max(1, ceil(mCPU / 1000)) - Examples:
- 1-1000 mCPU → 1 vCPU
- 1001-2000 mCPU → 2 vCPU
- 2001-3000 mCPU → 3 vCPU
Important Behavior: Due to rounding UP, the allocated vCPU may exceed the requested mCPU:
- 1001 mCPU requests → 2 vCPU allocated (2000 mCPU capacity)
- 1500 mCPU requests → 2 vCPU allocated (2000 mCPU capacity)
Memory Allocation
The reactor follows libvirt’s defaults for memory units.
The reactor attempts to detect units following the memory specification, and falls back to KiB as a default.
All of these are valid:
<memory unit='KiB'>{worker.resources.memory}</memory>
<memory unit='GB'>{worker.resources.memory}</memory>
When no units are specified, the units are translated in KiB:
<memory>{worker.resources.memory}</memory>
Complete Example
For a worker requesting 1500 mCPU and 4096 MiB memory:
<domain type='kvm'>
  <name>worker_example</name>
  <vcpu>2</vcpu>  <!-- Rounded UP from 1500 mCPU -->
  <memory unit='MiB'>4096</memory>
  <!-- Rest of configuration... -->
</domain>
Resource Impact: This worker will consume 2 vCPU worth of capacity (2000 mCPU) due to rounding, even though only 1500 mCPU was requested.
Thoradm
Thoradm is a command line tool similar to Thorctl that offers functionality only available to Thorium admins. While some admin functions are available in Thorctl (e.g. managing bans, notifications, and network policies), Thoradm focuses on functions focuses primarily on the infrastructure running Thorium.
Config
Thoradm uses both the Thorctl config for user information – to verify admin status, for example –
and the cluster config found in the thorium.yml file. The cluster config is required to perform
backups/restores of Thorium data, as it contains authentication information Thoradm needs to pull
and restore data from Redis, S3, and Scylla. You may not have a formal thorium.yml file, but you
can easily create one by copying the information you provide in the Thorium CRD (Custom Resource
Definition) in K8’s, specifically the section labeled config. It should look similar to the following:
config:
    elastic:
      node: <ELASTIC-NODE>
      password: <ELASTIC-PASSWORD>
      results: results-dev
      username: thorium-dev-user
    redis:
      host: <REDIS-HOST>
      password: <REDIS-PASSWORD>
    scylla:
      auth:
        password: <SCYLLA-PASSWORD>
        username: <SCYLLA-USERNAME>
      nodes:
      - <SCYLLA-NODES>
      replication: 2
      setup_time: 120
    thorium:
      assets:
    ...
Copy the entire config section to a separate file called thorium.yml, remove the config header,
and indent all lines to the left once to make elastic, redis, scylla, thorium, etc. the
main headers. With that, you should have a valid cluster config file to provide Thoradm. By default,
Thoradm will look for the config file in your current working directory, but you can provide a custom
path with the --cluster-conf/-c flag:
thoradm --cluster-conf <PATH-TO-THORIUM.YML>
Backup
Thoradm provides a helpful backup feature to manually backup important Thorium data, including Redis data, S3 data (including samples, repos, comment attachments, and results), tags, and metadata on Thorium nodes. Backups are especially helpful when upgrading Thorium to a new version, allowing admins to more easily revert back to a previous version if necessary.
thoradm backup -h
Backup a Thorium cluster

Usage: thoradm backup <COMMAND>

Commands:
  new      Take a new backup
  scrub    Scrub a backup for bitrot
  restore  Restore a backup to a Thorium cluster
  help     Print this message or the help of the given subcommand(s)

Options:
  -h, --help  Print help
Creating a Backup
To take a backup, run the following command:
thoradm backup new
You can provide the --output/-o flag to specify where to save the backup. Depending on the
size of your Thorium instance, the backup may be many TB in size, so choose a location suitable
to store that data.
thoradm backup new --output /mnt/big-storage
If your Thorium instance is very large, the backup command could take many hours. Running it as
a background process or in something like a detached tmux session might be wise.
Restoring a Backup
You can restore a Thorium backup with the following command:
thoradm backup restore --backup <BACKUP>
As with taking a new backup, restoring a backup could take several hours depending on the size of the backup. Bear in mind that the restore will wipe all current data in Thorium and replace it with the data to be restored. You might want to verify the backup hasn’t been corrupted in anyway before restoring by running the command in the following section.
Scrubbing a Backup
Thorium backups contain partitioned checksums that are used to verify the backup hasn’t been corrupted in some way overtime. You can recompute these checksums and verify the backup with the following command:
thoradm backup scrub --backup <BACKUP>
Thoradm will break the backup into chunks, hash each chunk, and check that the hash matches the one that’s stored in the backup. If there are any mismatches, one or more errors will be returned, and you can be fairly confident that the backup is corrupt. Restoring a corrupt backup could lead to serious data loss, so it’s important to verify a backup is valid beforehand.
System Settings
Thoradm also provides functionality to modify dynamic Thorium system settings that aren’t contained in the cluster config file described above. By “dynamic”, we mean settings that can be modified and take effect while Thorium is running without a system restart.
thoradm settings -h
Edit Thorium system settings

Usage: thoradm settings <COMMAND>

Commands:
  get     Print the current Thorium system settings
  update  Update Thorium system settings
  reset   Reset Thorium system settings to default
  scan    Run a manual consistency scan based on the current Thorium system settings
  help    Print this message or the help of the given subcommand(s)
Viewing System Settings
You can view system settings with the following command:
thoradm settings get
The output will look similar to the following:
{
  "reserved_cpu": 50000,
  "reserved_memory": 524288,
  "reserved_storage": 131072,
  "fairshare_cpu": 100000,
  "fairshare_memory": 102400,
  "fairshare_storage": 102400,
  "host_path_whitelist": [],
  "allow_unrestricted_host_paths": false
}
Updating System Settings
You can update system settings with the following command:
thoradm settings update [OPTIONS]
At least one option must be provided. You can view the commands help documentation to see a list of settings you can update.
Reset System Settings
You can restore all system settings to their defaults with the following command:
thoradm settings reset
Consistency Scan
Thorium will attempt to remain consistent with system settings as they are updated without a restart. It does this by running a consistency scan over all pertinent data in Thorium and updating that data if needed. There may be instances were data is manually modified by an admin or added such that they are no longer consistent. For example, an admin adds a host path volume mount with a path that is not on the host path whitelist, resulting in an image with an invalid configuration that is not properly banned.
You can manually run a consistency scan with the following command:
thoradm settings scan
Provision Thorium Resources
Thoradm can also provision resources for Thorium. Currently, nodes are the only resource available to be provisioned by Thoradm.
thoradm provision -h
Provision Thorium resources including nodes

Usage: thoradm provision <COMMAND>

Commands:
  node  Provision k8s or baremetal servers
  help  Print this message or the help of the given subcommand(s)

Options:
  -h, --help  Print help
Provision a Node
You can provision a K8’s node for Thorium’s use by providing the node’s target (IP address, hostname, etc.) and the path to the K8’s API keys file to authenticate with.
thoradm provision node --k8s <K8S-TARGET> --keys <PATH-TO-KEYS-FILE>
This will mark the node available for Thorium to schedule jobs to.
Common Issues
While Thorium is intended to be as easy and low maintenance as possible it is a scalable distributed system. As such at times issues will arise. This section aims to explain how to debug and resolve common issues.
Jobs Stuck In Created State
When jobs are stuck in the created state for an extended period of time this can be due to multiple issues:
- High load
- Outdated agent
- Missing Volumes
High Load
When the cluster has a high number of jobs in queue, jobs may be in a created state for an extended period of time. The fairshare scheduler should help mitigate this when other users are the cause of the load (the fair share scheduler balances across users, not images/pipelines). If the user experiencing the stuck jobs is also the cause of heavy load, the user needs to wait for their in-progress jobs to complete before their other jobs can be scheduled.
Outdated Agents
A common issue for jobs being stuck in the created state after updating Thorium is the agent failed to update. Before the agent claims any job it will check the version of the API against its own. If it is the incorrect version then the agent will exit without claiming a job.
Getting the current version
In order to get the current api version run the following command:
Outdated Agents: Kubernetes
In order to determine if the agent version is incorrect on kubernetes, first get pod logs with the following:
kubectl get pods -n <NAMESPACE> | grep "/1" | awk '{print $1}' | kubectl logs -n <Namespace> -f
If any of the logs show the agent exiting without claiming a job due to version mismatch, run the following command to update the Thorium agent on all nodes.
kubectl rollout restart deployment operator -n thorium
Outdated Agents: Bare Metal
On bare metal machines the agent is auto updated by the Thorium reactor. To confirm if the version is correct, simply run the following command to check the reactor:
/opt/thorium/thorium-reactor -V
Then to check the agent, run the following:
/opt/thorium/thorium-agent -V
In order to update the reactor, run the following command:
In order to update the agent, run the following command:
Missing Volumes
Another common issue that can cause K8s-based workers to get stuck in the created state is missing volumes. This occurs when the user has defined their image to require a volume, but the volume has not been created in K8s. This causes the pod to be stuck in the ContainerCreating state in K8s. To get pods in this state run the following command
kubectl get pods -n <NAMESPACE> | grep "ContainerCreating"
Then looks to see if any pods have been in that state for an extended period of time by checking the age of the pod. For example, this pod has been stuck for 10 minutes and is likely missing a volume.
➜ ~ kubectl get pods
NAME       READY   STATUS              RESTARTS   AGE
underwater-basketweaver-njs8smrl 0/1     ContainerCreating   0          10m
To confirm this is the issue describe the pod with the following command and check the events:
kubectl describe pod/<POD> -n <NAMESPACE>
If there is an event similar to the following, you are missing a volume that needs to be created.
Events:
  Type     Reason       Age                   From               Message
  ----     ------       ----                  ----               -------
  Normal   Scheduled    10m45s                 default-scheduler  Successfully assigned <NAMESPACE>/<POD> to <NODE>
  Warning  FailedMount  51s (x12 over 10m45s)  kubelet            MountVolume.SetUp failed for volume "important-volume" : configmap "important-volume" not found
Network Policies
Thorium network policies provide configurable, fine-grained network isolation for tools running in Thorium. They are currently exclusive to the Kubernetes Thorium scaler, as they are powered by Kubernetes Network Policies under the hood. Additionally, a compatible K8’s network plugin must also be installed in Thorium’s K8’s cluster for policies to actually apply (see the linked K8’s docs for more details).
Network policies can only be created, deleted, and updated by Thorium admins. They can be added to images by tool developers to allow network access to or from tools as needed. Network policies are also grouped like other resources in Thorium, so only policies in the same group as a tool can be added to that tool. A tool can have more than one network policy applied at once, and because network policies are additive (they only add access rather than removing access), network policies can never be incompatible with one another.
Base Network Policies
Network policies can only selectively allow network access to or from a tool in Thorium and don’t provide any interface to specifically restrict access. Instead, network access is restricted in that access is allowed only to the entities matching the network policy’s (or policies’) rules. Any entity not matching any of the rules is blocked.
That means that if a tool has no network policies applied, it will have blanket network access
to and from everything, which defeats the purpose of network policies in the first place. To
mitigate this, Thorium applies one or more “base network policies” to all tools running in Thorium,
regardless of their group or which network policies they have already applied. These base network
policies are defined in the configuration file thorium.yml (or in the Thorium Custom Resource
Definition when Thorium is deployed with the Thorium Operator). If no base network policy is given,
a default base policy is applied automatically that blocks all ingress/egress traffic except traffic
to/from from the Thorium API as well as to the K8’s CoreDNS and LocalNodeDNS services to allow
the Thorium agent to resolve the API’s hostname. The default base network policy is provided below
for your reference in Default Base Network Policy.
A base network policy must have a unique name among base network policies (but not necessarily unique to other network policies in Thorium) and a list of ingress/egress rules to apply. Below is an example base network policy to refer to when creating one in the Thorium config file. The schemas defined in Network Policy Schema may also prove useful.
thorium.yml:
...
  - thorium:
    ...
    - base_network_policies:
      - name: "base-policy-1"
        ingress:
          - allowed_ips:
            - cidr: 10.10.10.10
            - cidr: 10.10.0.0/16
              except:
                - 10.10.5.0/24
                - 10.10.6.0/24
            allowed_groups:
              - crabs
              - corn
            allowed_tools:
              - harvester
              - analyzer
            allowed_local: false
            allowed_internet: false
            allowed_all: false
            ports:
              - port: 1000
                end_port: 1006
                protocol: TCP
            allowed_custom:
              - namespace_labels:
                - key: ns-key1
                  value: ns-value1
                - key: ns-key2
                  value: ns-value2
              - pod_labels:
                - key: pod-key1
                  value: pod-value1
                - key: pod-key2
                  value: pod-value2
              - namespace_labels:
                - key: ns-with-pod-key
                  value: ns-with-pod-value
                pod_labels:
                - key: pod-with-ns-key
                  value: pod-with-ns-value
              - <MORE CUSTOM RULES>
          - <MORE RULES>
        egress:
          - <EGRESS RULES>
      - name: "base-policy-2"
        ingress:
          - <RULES>
        egress:
          - <RULES>
The base policy should be fairly restrictive to allow other network policies to open up access as needed. Alternatively, you can bypass Thorium’s network policy functionality altogether and allow full network access for all tools by providing a base network policy with rules to allow all traffic like below:
...
  - thorium:
    ...
    - base_network_policies:
      - name: "allow_all"
        ingress:
          allowed_all: true
        egress:
          allowed_all: true
Default Base Network Policy
If you want to provide other base network policies without overriding the default one, you need to manually provide the default policy in the Thorium CRD (Custom Resource Definition). Below is the default base network policy you can copy and paste to the CRD in addition to your custom base network policies:
- name: thorium-default
  ingress:
    - allowed_custom:
      - namespace_labels:
        - key: kubernetes.io/metadata.name
          value: thorium
        pod_labels:
          - key: app
            value: api
  egress:
    - allowed_custom:
      - namespace_labels:
        - key: kubernetes.io/metadata.name
          value: thorium
        pod_labels:
          - key: app
            value: api
    - allowed_ips:
      - cidr: 169.254.0.0/16
      - cidr: fe80::/10
      allowed_custom:
      - namespace_labels:
        - key: kubernetes.io/metadata.name
          value: kube-system
        pod_labels:
          - key: k8s-app
            value: kube-dns
      - namespace_labels:
        - key: kubernetes.io/metadata.name
          value: kube-system
        pod_labels:
          - key: k8s-app
            value: node-local-dns
      ports:
        - port: 53
          protocol: UDP
Network Policy Types
Forced Network Policies
A forced network policy is forcibly applied in the Thorium scaler to all tools that are in the policy’s groups. Forced policies work similarly to base network policies in that they are not directly attached to any specific tools and do not appear in an image’s info if it wasn’t explictly added to an image.
Default Network Policies
A default network policy is a policy that is added to newly-created images in its group(s) when no other policy is provided by the user. Unlike forced network policies, default policies are directly added to images and will appear in an image’s info.
If a network policy is set to no longer be default, it will not be automatically removed from the images it was added to.
Network Policy Schema
Creating, updating, and managing network policies in Thorium requires an understanding of their components. Below are a list of fields that make up a network policy, their descriptions, accepted values, and whether or not the field is required. Use this info to write rules files when creating network policies as well as set the base network policy to apply to all tools in a Thorium instance.
Network Policy Request
Below are the fundamental components required (or not required) to create a network policy:
| Field | Description | Accepted Values | Required |
|---|---|---|---|
| name | The name of the network policy | Any UTF-8 string | yes |
| groups | The names of groups the network policy should be in | Any names of groups existing in the Thorium instance | yes |
| ingress | A list of rules applying to ingress traffic into tools; if not provided, all traffic is allowed in; if explicitly set to be empty (no rules), no traffic is allowed in | See Rules | no |
| egress | A list of rules applying to egress traffic from tools; if not provided, all traffic is allowed out; if explicitly set to be empty (no rules), no traffic is allowed out | See Rules | no |
| forced_policy | Sets the policy to apply to all tools spawned in its group(s); forced policies are not actually saved to individual images and are applied in the scaler when images are spawned | true/false (default: false) | no |
| default_policy | Sets the policy to be added by default to an image on creation if no other policies are given; default policies are actually saved to all new images in their groups | true/false (default: false) | no |
Rules
A network policy rule dictates which specific entities a Thorium image can connect to or be connected from. Rules are additive, meaning they combine together and can never deny what another rule allows. If one rule allows ingress access from the “corn” group, no other rule can deny access from that group. This also means policy rules are never incompatible with each other.
| Field | Description | Accepted Values | Required |
|---|---|---|---|
| allowed_ips | A list of IP’s to allow | See IP Blocks | no |
| allowed_groups | A list of groups to allow | A name of any group existing in the Thorium instance | no |
| tools | A list of tools to allow | Any valid tool name | no |
| allowed_local | Allows all IP addresses in the local IP address space access | true/false (default: false) | no |
| allowed_internet | Allows all IP addresses in the public IP address space access | true/false (default: false) | no |
| allowed_all | Allows from all entities | true/false (default: false) | no |
| ports | A list of ports this rule applies to; if not provided, the rule will apply on all ports | See Ports | no |
| allowed_custom | A list of custom rules allowing access to peers on K8’s matched by namespace and/or pod label(s) | See K8’s Custom Rules | no |
IP Blocks
An IP block defines one or more IP addresses to allow access to or from. They can be defined as a simple IP address or as an IP CIDR covering an address space. In the later case, an optional list of CIDR’s can be provided to exclude certain addresses access within an address space.
| Field | Description | Valid Values | Required |
|---|---|---|---|
| cidr | A IPv4 or IPv6 CIDR or a single IPv4 or IPv6 address to allow | A valid IPv4/IPv6 CIDR or address | yes |
| except | A list of CIDR’s to exclude from the allowed CIDR described above | Zero or more CIDR’s within the allowed CIDR described above; an error occur if any of the CIDR’s are not in the allowed CIDR’s address space, are of a different standard (v4 vs v6), or if the cidr above is a single IP address and except CIDR’s were provided | no |
Ports
Ports limit the scope of a given network policy rule to a single port or a range of ports and optionally a specific protocol.
For example, if a user wanted to allow access to port 80 over TCP from any entity, they could provide
an ingress rule with allowed_all=true and a port rule with port=80 and protocol=TCP. If a user
wanted to allow tools to access ports 1000-1006 over any protocol but only to tools in the “corn”
group, they could provide an egress rule with allowed_groups=["corn"] and a port rule with
port=1000, end_port=1006, and no value set for protocol.
| Field | Description | Valid Values | Required |
|---|---|---|---|
| port | The port to allow, or the first port in a range of ports to allow when used in conjunction with end_port | Any valid port number (1-65535) | yes |
| end_port | The last port in the range of ports starting with port | Any valid port number (1-65535) | no |
| protocol | The protocol to allow on the specified port(s); if not provided, all protocols are allowed | TCP/UDP/SCTP | no |
K8’s Custom Rules
K8’s custom rules provide fine-grained control to allow tool access to or from entities in the K8’s cluster that aren’t in Thorium. You can provide namespace labels to match for entire namespaces or pod labels to match for specific pods. If both namespace and pod labels are specified, only pods with all of the given pod labels that are in a namespace with all of the given namespace labels will match.
| Field | Description | Accepted Values | Required |
|---|---|---|---|
| namespace_labels | A list of labels matching namespaces to allow | See K8’s Custom Labels | no |
| pod_labels | A list of labels matching pods to allow | See K8’s Custom Labels | no |
K8’s Custom Labels
K8’s custom labels will match K8’s resources with the given key/value pairs.
| Field | Description | Accepted Values | Required |
|---|---|---|---|
| key | The label key to match on | Any valid K8’s label name (see the K8’s docs) | yes |
| value | The label value to match on | Any valid K8’s label name (see the K8’s docs) | yes |
Network Policies
Thorctl provides helpful commands to create, delete, and update network policies in a Thorium instance.
You can find a list of those commands by running thorctl network-policies --help (or, alternatively,
thorctl netpols --help).
Creating a Network Policy
To create a network policy, use the thorctl netpols create command:
$ thorctl netpols create --help
Create a network policy in Thorium

Usage: thorctl network-policies create [OPTIONS] --name <NAME> --groups <GROUPS> --rules-file <RULES_FILE>

Options:
  -n, --name <NAME>              The name of the network policy
  -g, --groups <GROUPS>          The groups to add this network policy to
  -f, --rules-file <RULES_FILE>  The path to the JSON/YAML file defining the network policy's rules
      --format <FORMAT>          The format the network policy rules file is in [default: yaml] [possible values:
                                 yaml, json]
      --forced                   Sets the policy to be forcibly applied to all images in its group(s)
      --default                  Sets the policy to be a default policy for images in its group(s), added to new
                                 images when no other policies are given
  -h, --help                     Print help
You can set the name and groups of the network policy using the --name and --groups flags (note that
multiple groups can be delimited with a ,):
thorctl netpols create --name my-policy --groups crabs,corn ...
The Rules File
The actual content of the network policy is defined in a “rules file”, a YAML or JSON-formatted list of rules the network policy should have. You can use the template network policy files below for reference. For more information on accepted values for each field in the rules file, see the Network Policy Rules Schema
rules-file.yaml:
ingress:
  - allowed_ips:
    - cidr: 10.10.10.10
    - cidr: 10.10.0.0/16
      except:
        - 10.10.5.0/24
        - 10.10.6.0/24
    allowed_groups:
      - crabs
      - corn
    allowed_tools:
      - harvester
      - analyzer
    allowed_local: false
    allowed_internet: false
    allowed_all: false
    ports:
      - port: 1000
        end_port: 1006
        protocol: TCP
    allowed_custom:
      - namespace_labels:
        - key: ns-key1
          value: ns-value1
        - key: ns-key2
          value: ns-value2
      - pod_labels:
        - key: pod-key1
          value: pod-value1
        - key: pod-key2
          value: pod-value2
      - namespace_labels:
        - key: ns-with-pod-key
          value: ns-with-pod-value
        pod_labels:
        - key: pod-with-ns-key
          value: pod-with-ns-value
      - <MORE CUSTOM RULES>
  - <MORE RULES>
egress:
  - <EGRESS RULES>
rules-file.json:
{
  "ingress": [
    {
      "allowed_ips": [
        {
          "cidr": "10.10.10.10",
        },
        {
          "cidr": "10.10.0.0/16",
          "except": [
            "10.10.5.0/24",
            "10.10.6.0/24"
          ]
        }
      ],
      "allowed_groups": [
        "crabs",
        "corn"
      ],
      "allowed_tools": [
        "harvester",
        "analyzer"
      ],
      "allowed_local": false,
      "allowed_internet": false,
      "allowed_all": false,
      "ports": [
        {
          "port": 1000,
          "end_port": 1006,
          "protocol": "TCP"
        }
      ],
      "allowed_custom": [
        {
          "namespace_labels": [
            {
              "key": "ns-key1",
              "value": "ns-value1"
            },
            {
              "key": "ns-key2",
              "value": "ns-value2"
            }
          ],
        },
        {
          "pod_labels": [
            {
              "key": "pod-key1",
              "value": "pod-value1"
            },
            {
              "key": "pod-key2",
              "value": "pod-value2"
            }
          ]
        },
        {
          "namespace_labels": [
            {
              "key": "ns-plus-pod-key",
              "value": "ns-plus-pod-value"
            }
          ],
          "pod_labels": [
            {
              "key": "pod-plus-ns-key",
              "value": "pod-plus-ns-value"
            }
          ]
        }
      ]
    }
  ],
  "egress": []
}
Ingress/Egress: Missing Vs. Empty
Note the subtle difference between a missing ingress/egress section and providing a section explicitly with no rules.
If an ingress/egress section is missing, the created network policy will have no effect on traffic in that direction. For example, let’s create a network policy with the following rules file:
ingress:
  - allowed_all: true
The above network policy will allow all traffic on ingress, but has no bearing on egress traffic whatsoever. It won’t restrict egress traffic, nor will it allow any egress traffic if egress is restricted by another network policy.
Conversely, if an ingress/egress section is provided but has no rules, the network policy will restrict all traffic in that direction. Let’s change the rules file above to restrict all traffic on egress but not affect ingress:
egress:
The egress section was provided but has no rules, so all egress traffic will be restricted. The ingress section was skipped entirely, so ingress traffic will not be affected by this network policy.
And by this logic, we can provide an empty list of rules for ingress and egress to restrict all traffic in both directions:
YAML:
ingress:
egress:
JSON:
{
  "ingress": [],
  "egress": [],
}
No Rules File or Empty Rules Files
What if we give a rules file that is missing both ingress and egress, or we don’t provide a rules file at all? In that case, the resulting network policy will restricting all traffic on ingress and not affecting egress at all. So an empty rules file has the same behavior as this one:
ingress:
This nuance is due to Kubernetes default behavior for created network policies. From Kubernetes Network Policies docs:
“If no policyTypes are specified on a NetworkPolicy then by default Ingress will always be set and Egress will be set if the NetworkPolicy has any egress rules.”
Help
Confused about something in Thorium or these docs? Check out our FAQ.
Are you having trouble using Thorium? Please reach out: Contact Us
Frequently Asked Questions
Docs
Why can’t I view the videos embedded in these docs?
The videos in these docs are AV1 encoded. Since version 116, the Edge browser for Windows does not come with a builtin plugin for viewing AV1 formatted video. Instead you need to search for an add-on extension via Microsoft’s website. Most other browsers such as Chrome, come with AV1 support by default.
Data
What data types can be uploaded to Thorium?
Thorium is primarily a file analysis and data generation platform. As such, it supports two primary types of data:
- files
- repositiories (Git)
There are no restrictions on the file types that Thorium supports. All files are treated like raw data and safely packaged using CaRT upon upload. Some commonly uploaded file formats include binary executables (PEs, ELFs, etc.), library files (DLLs), archives (zips), office documents (PDFs) and many more. Repositories are a separate data type that can also be ingested into Thorium and comes with some additional features that enable building of versioned binaries from a large number of repos at scale.
What is CaRT and how can I unCaRT malware samples that I download from Thorium?
CaRT is a file format for the safe and secure transfer of malware samples and was developed by Canada’s CSE. CaRTed files are neutered and encrypted to prevent accidental execution or quarantine by antivirus software when downloaded from Thorium. All files are CaRTed by the Thorium API upon upload and must be unCaRTed by the user after they are downloaded. You can use the Thorium CLI tool (Thorctl) to unCaRT your downloaded file. For more info about Thorctl see our setup instructions.
Tools
How can I add my own tools and build pipelines in Thorium?
Thorium has been designed to support quickly adding new tools and building pipelines from those tools. Tools do not need to understand how to communicate with the Thorium API or the CaRT file storage format. Any command line tool that can be configured to run within a container or on BareMetal can be run by Thorium. You can read more about the process for adding tools and pipelines in the developer docs.
Sharing and Permissions
How can I share or limit sharing of the data I upload to Thorium?
All data is uploaded to a group and only people within that group can see that group’s data. If you want to share data with someone, you can add that person to the group or reupload that data to one of their groups. You can read about how Thorium manages data access with groups and how group and system roles affect the ability of users to work with Thorium resources in the Roles and Permissions section of the Getting Started chapter.
What is Traffic Light Protocol (TLP) and does Thorium support TLP levels for files?
TLP provides a simple and intuitive schema for indicating when and how sensitive information can be shared, facilitating more frequent and effective collaboration. - https://www.cisa.gov/tlp
The Thorium Web UI supports tagging uploaded files with a TLP metadata tag. This tag is treated just like any other tag that is applied to a new or existing file. If the TLP level changes, a Thorium user with the correct permissions can modify that TLP tag in order to ensure it is kept up-to-date.
Contact Us
If you are having issues using Thorium please reach out to the admins for your organization’s Thorium instance. If you would like to report a bug or provide feedback about your experience using Thorium, please reach out to the Thorium developers.