Troubleshooting Logging Made Easy (LME) Install
Installation
Installing LME involves preparing the system environment, meeting hardware requirements, and configuring components to ensure smooth setup and operation.
Note: Make sure to use -i to run a login shell with any commands that run as root, so that environment variables are set properly. For more information, reference Unix and Linux.
Note: Service startup may take several minutes--please allow time before assuming an issue has occurred.
-
Confirm Services Are Installed
-
To confirm services are installed, run:
sudo systemctl daemon-reloadsudo systemctl list-unit-files lme\* -
Debug if necessary; to check the status of individual services listed above, run:
#if something breaks, use these commands to debug:SERVICE_NAME=lme-elasticsearch.servicesudo -i journalctl -xu $SERVICE_NAME -
If something is broken, try restarting the services and making sure failed services reset before starting by running:
#try resetting failed:sudo -i systemctl reset-failed lme*sudo -i systemctl restart lme.service
-
-
Verify Containers are Running and Healthy
-
To verify, run:
sudo -i podman ps --format "{{.Names}} {{.Status}}" -
Example output:
lme-elasticsearch Up 19 hours (healthy)lme-wazuh-manager Up 19 hourslme-kibana Up 19 hours (healthy)lme-fleet-server Up 19 hourslme-elastalert2 Up 17 hours -
This also prints the names of the containers in the first column of text on the left.
Note: We are currently missing health checks for Fleet Server and ElastAlert2. If those appear, they won't show healthy and that's expected. Health checks for these services will be added in a future version.
-
If a container is missing, check its logs by running:
#also try inspecting container logs:CONTAINER_NAME=lme-elasticsearch #change this to your container name you want to monitor lme-kibana, etc...sudo -i podman logs -f $CONTAINER_NAME
-
-
Verify You Can Connect to Elastisearch
-
To verify you can connect to Elasticsearch, run:
#substitute your password below:curl -k -u elastic:$(sudo -i ansible-vault view /etc/lme/vault/$(sudo -i podman secret ls | grep elastic | awk '{print $1}') | tr -d '\n') https://localhost:9200 -
Example output:
{"name" : "lme-elasticsearch","cluster_name" : "LME","cluster_uuid" : "FOnfbFSWQZ-PD-rU-9w4Mg","version" : {"number" : "8.12.2","build_flavor" : "default","build_type" : "docker","build_hash" : "48a287ab9497e852de30327444b0809e55d46466","build_date" : "2024-02-19T10:04:32.774273190Z","build_snapshot" : false,"lucene_version" : "9.9.2","minimum_wire_compatibility_version" : "7.17.0","minimum_index_compatibility_version" : "7.0.0"},"tagline" : "You Know, for Search"}
-
-
Verify You Can Connect to Kibana
-
To verify that Kibana is accessible, use a Secure Shell (SSH) proxy to forward a local port to the remote Linux host.
-
Log in as the Elastic admin using the
elasticusername and the password retrieved from the Retrieving Passwords section of the Install document. -
Run the following command:
#connect via ssh if you need tossh -L 8080:localhost:5601 [YOUR-LINUX-SERVER]#go to browser:#https://localhost:8080 -
In your local browser, navigate to Kibana using the IP address you defined for
IPVAR.
-
Post-Installation
After completing the installation of LME, it's important to verify that all core components are set up correctly and functioning as expected. The following steps help confirm that dashboards for Elastic and Wazuh were properly installed:
-
Run the following commands to verify that the dashboard installation was successful on
/opt/lme/dashboards/elastic/and/opt/lme/dashboards/wazuh/directories:sudo -ils -al /opt/lme/FLEET_SETUP_FINISHEDls -al /opt/lme/dashboards/elastic/INSTALLEDls -al /opt/lme/dashboards/wazuh/INSTALLED -
It should appear as the following:
root@ubuntu:~# ls -al /opt/lme/FLEET_SETUP_FINISHED-rw-r--r-- 1 root root 0 Oct 21 18:41 /opt/lme/FLEET_SETUP_FINISHEDroot@ubuntu:~# ls -al /opt/lme/dashboards/elastic/INSTALLED-rw-r--r-- 1 root root 0 Oct 21 18:44 /opt/lme/dashboards/elastic/INSTALLEDroot@ubuntu:~# ls -al /opt/lme/dashboards/wazuh/INSTALLED-rw-r--r-- 1 root root 0 Oct 21 19:01 /opt/lme/dashboards/wazuh/INSTALLED
Note: If these files don't appear, something likely went wrong during installation. Review the output from Ansible carefully. If you suspect a bug, feel free to file an issue. Otherwise, for troubleshooting help related to your local setup, please start a discussion instead.
Logging Issues
Space Issues During Install
If your system has size constraints and doesn't meet the expected requirements, you may encounter issues like the Getting Error with Step 3.2.2 when Running the deploy.sh script.
-
You can try DISK-SPACE-20.04:
root@util:# vgdisplayroot@util:# lvextend -l +100%FREE /dev/mapper/ubuntu--vg-ubuntu--lvroot@util:~# resize2fs /dev/mapper/ubuntu--vg-ubuntu--lv
Containers Restarting/Not Running
If you're having issues with containers restarting, check both the host and the container logs (e.g., a wrong password could prevent Elastic Stack from operating properly).
-
To inspect the container logs, run:
sudo -i podman ps --format "{{.Names}} {{.Status}}" -
Use the container name found in the above output to check its logs by running:
#Using the above name you found, check its logs here.sudo -i podman logs -f $CONTAINER_NAME -
If this doesn’t resolve the issue, reference the next section for common problems that may be encountered.
Container Troubleshooting
Podman Commands Hang (SQLite Lock Deadlock)
Symptoms
podman pshangs indefinitely — no output, no errorpodman exec <container> <command>never returnssystemctl status lme-*shows all services asactive (running)despite podman being unresponsive- Container healthchecks stop updating
Root Cause
Podman uses a SQLite database (/var/lib/containers/storage/db.sql) with file-level locking. When any podman process acquires the DB lock and hangs (e.g., a podman exec waiting on a slow command, or a healthcheck timing out), every subsequent podman command queues behind it.
Common triggers:
- A long-running
podman execthat never completes (e.g., Ansible automation runningagent_control -l) - Healthcheck processes (
podman healthcheck run) that fire while the lock is held - Multiple concurrent
podmancalls from monitoring or automation tools
This creates a deadlock chain: the original stuck process holds the lock, healthchecks queue behind it, and all manual commands queue behind those.
Diagnosis
1. Check for stuck podman processes:
ps aux | grep -E "podman (ps|info|exec|healthcheck)" | grep -v grep
2. Identify the DB lock holders:
sudo fuser /var/lib/containers/storage/db.sql
The oldest PID (lowest number) is typically the root cause.
3. Identify what the oldest process is doing:
ps -p <PID> -o pid,etime,args
Resolution
Step 1: Kill the stuck process
sudo fuser /var/lib/containers/storage/db.sql
sudo kill <oldest_PID>
Step 2: Kill cascaded stuck processes
sudo kill $(ps aux | grep -E "podman (exec|healthcheck|ps|info)" | grep -v grep | awk '{print $2}') 2>/dev/null
Step 3: Verify podman is responsive
sudo timeout 5 podman ps --format "{{.Names}}: {{.Status}}"
If this returns container status within 5 seconds, podman is recovered.
If Containers Stop After Clearing the Lock
Killing stuck processes may cascade to container stops (conmon exits). Restart services in dependency order:
# 1. Elasticsearch first
sudo systemctl restart lme-elasticsearch
sleep 10

# 2. Wazuh and Kibana (independent of each other)
sudo systemctl restart lme-wazuh-manager lme-kibana lme-elastalert2
sleep 15

# 3. Fleet last (requires Kibana)
sudo systemctl restart lme-fleet-server
sleep 5

# 4. Verify
sudo podman ps --format "table {{.Names}}\t{{.Status}}"
Quick Recovery Script
#!/bin/bash
# Save as /usr/local/bin/lme-podman-recover.sh
set -e

echo "Checking for stuck podman processes..."
STUCK=$(ps aux | grep -E "podman (exec|healthcheck|ps|info)" | grep -v grep | awk '{print $2}')

if [ -z "$STUCK" ]; then
    echo "No stuck processes found."
    exit 0
fi

echo "Found stuck PIDs: $STUCK"
echo "Killing stuck processes..."
echo "$STUCK" | xargs kill 2>/dev/null
sleep 3

if timeout 5 podman ps > /dev/null 2>&1; then
    echo "Podman recovered. Containers still running."
    podman ps --format "table {{.Names}}\t{{.Status}}"
else
    echo "Containers stopped. Restarting LME services..."
    systemctl restart lme-elasticsearch
    sleep 10
    systemctl restart lme-wazuh-manager lme-kibana lme-elastalert2
    sleep 15
    systemctl restart lme-fleet-server
    sleep 5
    podman ps --format "table {{.Names}}\t{{.Status}}"
fi
Prevention
- Timeout-wrap all
podman execcalls:sudo timeout 30 podman exec lme-wazuh-manager /var/ossec/bin/agent_control -l - Avoid concurrent podman commands during deployments or automation runs
- Monitor with a canary check:
sudo timeout 5 podman ps || echo "PODMAN LOCK ISSUE"
Elasticsearch Password Mismatch (401 Unauthorized)
Symptoms
"type" : "security_exception",
"reason" : "unable to authenticate user [elastic] for REST request [/...]"
extract_secrets.sh returns a password but Elasticsearch rejects it.
Root Cause
Running install.sh multiple times (e.g., repeated Ansible deployments) can regenerate the Elasticsearch internal keystore password while the podman secret store retains the old value. The password in podman's secret store drifts from what Elasticsearch actually has.
Resolution
LME provides password_management.sh for credential rotation:
# List available users
sudo -i ${CLONE_DIRECTORY}/scripts/password_management.sh -l

# Reset a specific user's password
sudo -i ${CLONE_DIRECTORY}/scripts/password_management.sh -s
If password_management.sh is unavailable, reset directly via the ES API:
# Get current (stale) password from vault
source /opt/lme-install/scripts/extract_secrets.sh -q

# Reset via container
sudo podman exec lme-elasticsearch elasticsearch-reset-password -u elastic --batch
Or via the _security API if you know any valid credential:
curl -sk -X POST -u "elastic:CURRENT_PASSWORD" \
  https://localhost:9200/_security/user/elastic/_password \
  -H 'Content-Type: application/json' \
  -d '{"password": "NEW_PASSWORD_HERE"}'
Verify
curl -sk -u "elastic:<NEW_PASSWORD>" https://localhost:9200/_cluster/health?pretty
Expected: "status" : "green"
Dependent Containers That Must be Removed
Sometimes Podman doesn't clean up containers properly when stopping and restarting the lme.service
-
If you get the following error after inspecting the logs in systemd:
#journal:journalctl -xeu lme-elasticsearch.service#OR systemctlsystemctl status lme*Error:
ubuntu lme-elasticsearch[43436]: Error: container bf9cb322d092c13126bd0341a1b9c5e03b475599e6371e82d4d866fb088fc3c4 has dependent containers which must be removed before it: ff7a6b654913838050360a2cea14fa1fdf5be1d542e5420354ddf03b88a1d2c9: container already existsThen you'll need to do the following:
-
Kill the other containers it lists manually by running:
sudo -i podman rm ff7a6b654913838050360a2cea14fa1fdf5be1d542e5420354ddf03b88a1d2c9sudo -i podman rm bf9cb322d092c13126bd0341a1b9c5e03b475599e6371e82d4d866fb088fc3c4 -
Remove other containers that are dead by running:
sudo -i podman ps -asudo podman rm $CONTAINER_ID -
Restart the
lme.serviceby running:systemctl restart lme.service
-
Memory in Containers (Need More RAM/Less RAM Usage)
-
If you're on a resource-constrained host and need to limit/edit the memory used by the containers, add the following into the quadlet file:
....EnvironmentFile=/opt/lme/lme-environment.envImage=localhost/elasticsearch:LME_LATESTNetwork=lmePodmanArgs=--memory 8gb --network-alias lme-elasticsearch --health-interval=2sPublishPort=9200:9200Ulimit=memlock=-1:-1Volume=lme_certs:/usr/share/elasticsearch/config/certs....
Notes
-
You don't need to run the commands listed above. Instead, modify the quadlet file you want to update.
- If this is before you've installed LME, edit the quadlet file in the
~/LME/quadlet/lme-elasticsearch.containerdirectory of the cloned repository.
- If this is before you've installed LME, edit the quadlet file in the
-
If this is after installation, edit the quadlet file located at
/etc/containers/systemd/lme-elasticsearch.containerby runningquadlet/lme-elasticsearch.container. Add the line--memory Xgbwith the number of Gigabytes you want to limit for the container. -
You can repeat this for any containers you for which you want to limit the memory.
Java Virtual Machine (JVM) Heap Size
If your server has a large amount of RAM (e.g., greater than 128GB) and you want your container to use that memory--especially for components like Elasticsearch that run under the JVM--you'll need to adjust the JVM options.
-
Edit the
ES_JAVA_OPTSvariable. Elastic's documentation on JVM options provides more details. -
By default, Elasticsearch only goes up to 31GB of memory usage unless otherwise configured (e.g., if you have a server that has 128GB and you want to use 64 [the recommendation is half of your total memory].
-
To edit the container file, run:
sudo nano /opt/lme/quadlet/lme-elasticsearch.container -
To add or update the following line, run:
Environment=ES_JAVA_OPTS=-Xms64g -Xmx64g -
To reload the system daemon and restart the service, run:
systemctl --user daemon-reloadsystemctl --user restart lme.service
-
Elastic
Manual Dashboard Install
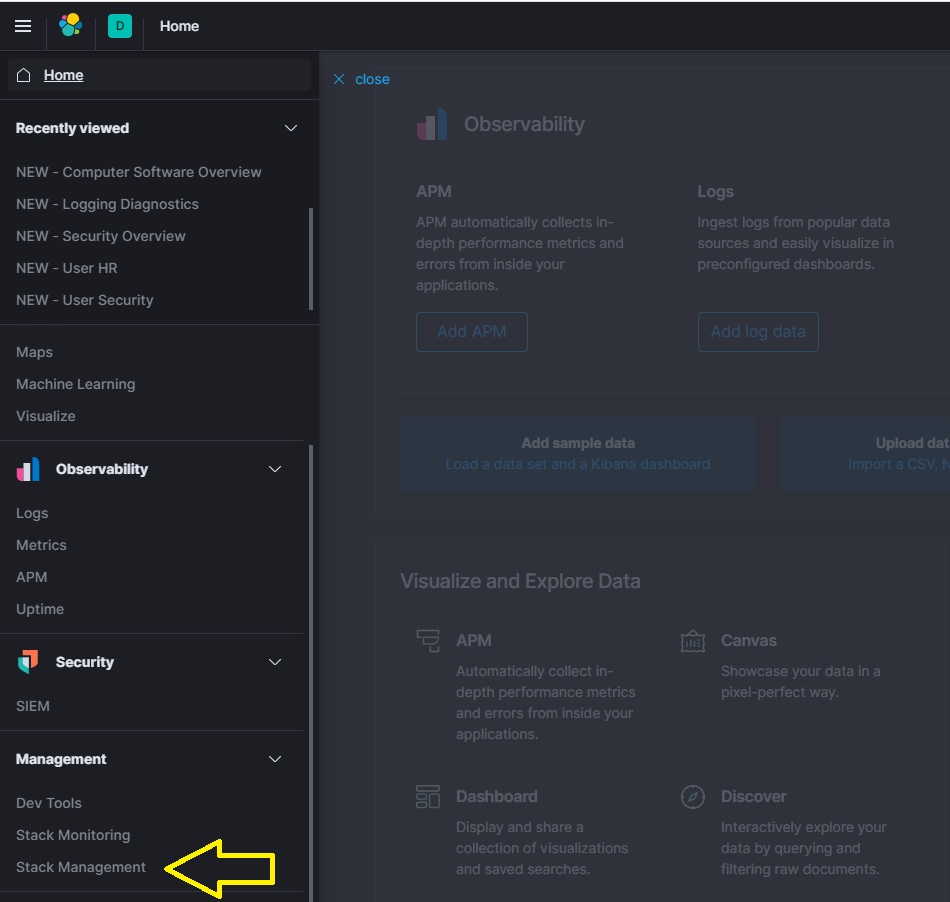
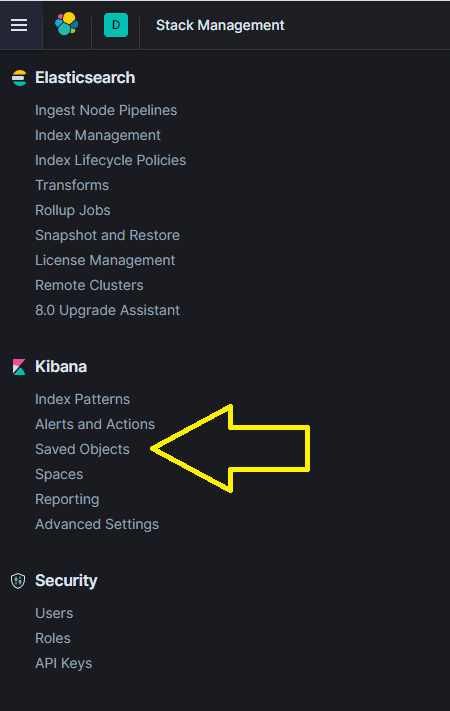
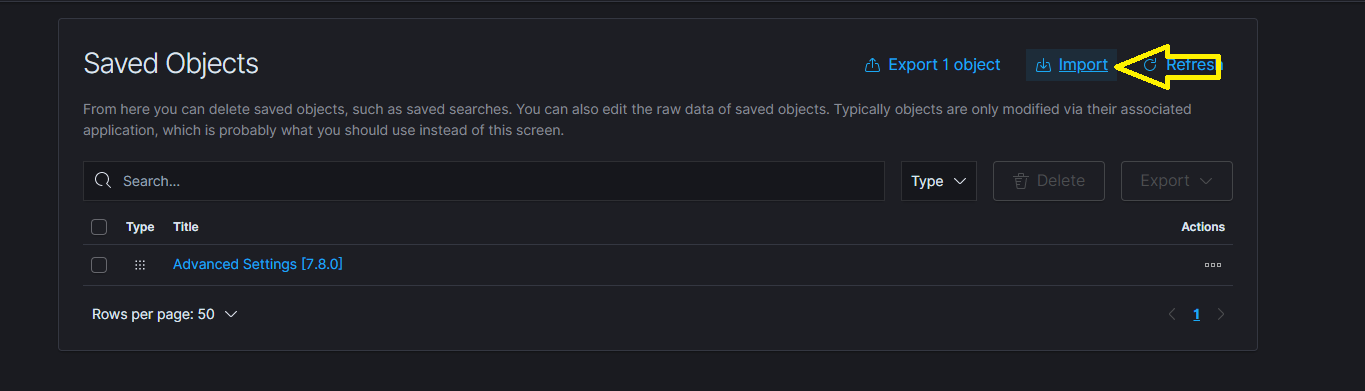
You can manually import the dashboards by navigating to ‘Management’ -> ‘Stack Management’ -> ‘Saved Objects’.
Proceed to follow the steps in the figures below.
Note: This step should not be required by default. Only use if the installer failed to automatically populate the expected dashboards or if you wish to make use of your own modified version of the supplied visualizations.
Each dashboard and its visualization objects are contained within a NDJSON file (previously JSON) and can be easily imported. The NDJSON files are available in the dashboards/ directory.
Elastic Specific
Elastic maintains a comprehensive set of troubleshooting guides we recommend reviewing as part of your standard investigation process. If your issue appears to originate from the Elastic Stack, these resources can help.
Issues Installing Elastic Agent
If you have encountered the error "Elastic Agent is installed but broken" when trying to install the Elastic Agent add the following flag to your install command:
--force
Changing Elastic Username Password
After installing, if you wish to change the password to the Elastic username, run:
sudo curl -X POST "https://127.0.0.1:9200/_security/user/elastic/_password" -H "Content-Type: application/json" -d'
{
  "password" : "newpassword"
}' --cacert /opt/lme/Chapter\ 3\ Files/certs/root-ca.crt -u elastic:currentpassword
Kibana Discover View Showing Wrong Index
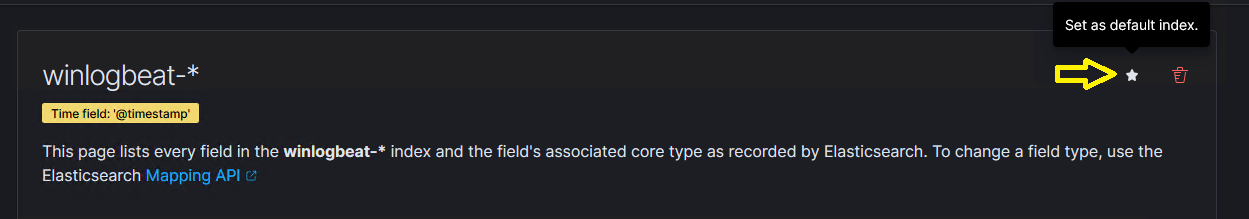
If the Discover section of Kibana persistently displays the wrong index by default, verify that the winlogbeat index pattern is set as the default.
Follow the steps below to correct this issue:
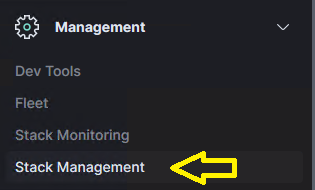
- Click Stack Management from the left-hand menu.
- Click Index Patterns under Kibana Stack Management.
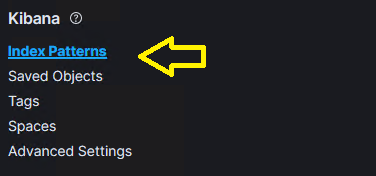
- Verify that the Default label is set next to the
INDEX_NAME-*index pattern.
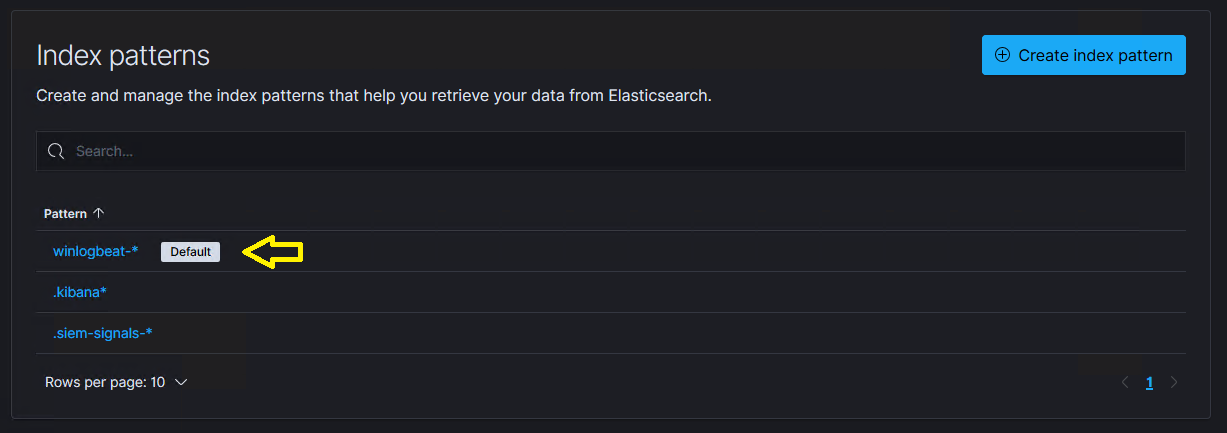
- If this Index pattern is not selected as the default, click on the
INDEX_NAME-*pattern, and then select the following option on the subsequent page.
Note: You will need to run this command with an account that can access /opt/lme. If you can't sudo, the user account will need access to the certifications located in the command.
Unhealthy Cluster Status
The cluster health may appear as yellow or red for several reasons. One common cause is unassigned replica shards. Since LME uses a single-node Elasticsearch instance by default, replicas cannot be assigned. This issue often arises from built-in indices that don't have the index.auto_expand_replicas setting properly configured.
This will be fixed in a future release of Elastic, but can be temporarily diagnosed and resolved as follows:
-
Check the cluster health by running the following request against Elasticsearch (an easy way to do this is to navigate to
Dev Toolsin Kibana underManagementon the left-hand menu) by running:GET _cluster/health?filter_path=status,*_shards -
If it shows any unassigned shards, these can be enumerated by running:
GET _cat/shards?v=true&h=index,shard,prirep,state,node,unassigned.reason&s=state -
If the
UNASSIGNEDshard is shown asrrather thanp, this means it's a replica. In this case you can fix the error in the single-node default installation of LME by forcing all indices to have a replica count of 0 by running:PUT _settings{"index.number_of_replicas": 1} -
If the above solution was unable to resolve your issue, further information on this and general advice on troubleshooting an unhealthy cluster status can be found here.
Fleet Server - Add Agent Shows Missing URL for Fleet Server Host
When attempting to add Elastic Agent on the host server, you may see the message Missing URL for Fleet Server host--as shown in the figure below.
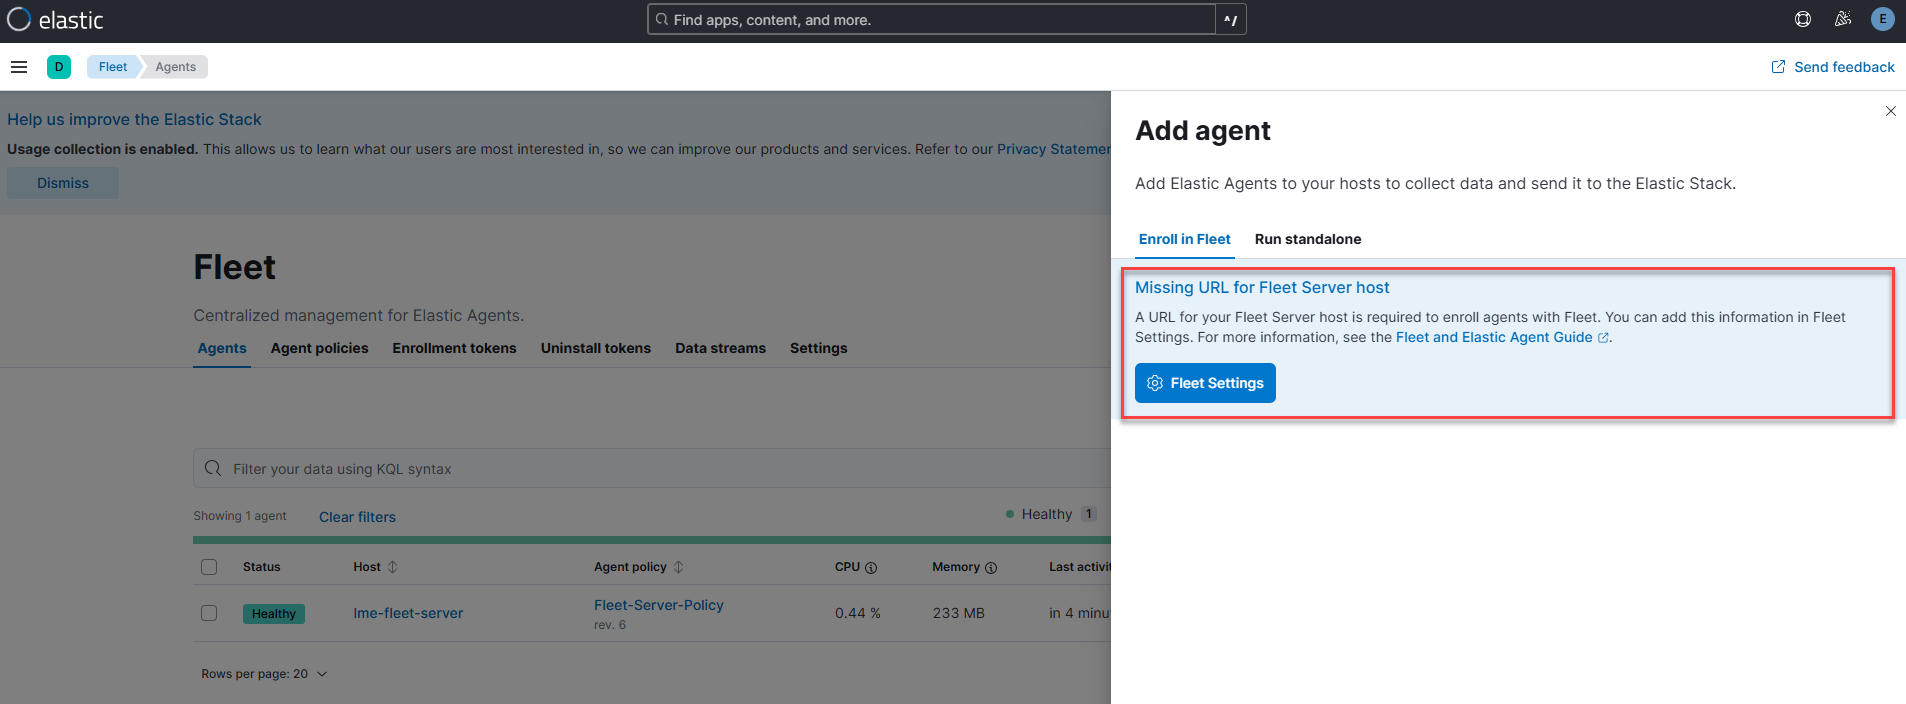
This typically happens when post-installation steps are run before the lme-fleet-server container displays a status of Up in podman status.
Note: To avoid this, always wait until all post-installation verification steps are complete.
If you've already run the setup prematurely, we recommend uninstalling and reinstalling LME. Alternatively, restarting the host server or simply restarting lme-service may resolve the issue.
Start/Stop LME
Re-Indexing Errors
For errors encountered when re-indexing existing data as part of an an LME version upgrade, please review the Elastic re-indexing documentation for assistance.
Illegal Argument Exception While Re-Indexing
With the correct mapping in place, it is not possible to store a string value in any of the fields which represent IP addresses (e.g., source.ip, destination.ip). If you see any of these values represented in your current data as strings, (e.g.,LOCAL), you cannot successfully re-index with the correct mapping.
In this instance, the simplest fix is to modify your existing data to store the relevant fields as valid IP representations using the update_by_query method that is located here.
An example of this is shown below, which may need to be modified for the particular field that is causing problems:
POST winlogbeat-11.06.2021/_update_by_query
{
  "script": {
    "source": "ctx._source.source.ip = '127.0.0.1'",
    "lang": "painless"
  },
  "query": {
    "match": {
      "source.ip": "LOCAL"
    }
  }
}
Note: Run this command for each index that includes problematic mappings before re-indexing can proceed.
TLS Certificates Expired
LME installs a self-signed certificate for HTTPS during setup. These certificates are valid for two years from the time of installation.
After expiration, LME services will stop functioning properly. To remedy this, you can either:
-
Reinstall LME (which re-generates certificates without reinstalling
-
Use the
lme-cascript to manually regenerate and replace certificates without reinstalling
For more information, follow the instructions detailed here.
Other Common Errors
Windows Log with Error Code #2150859027
If you are running Windows Server 2016 or newer and encounter error code 2150859027 (or messages about HTTP URLs not being available in your Windows logs), reference this Microsoft guide for resolution steps.
Start/Stop LME
-
To stop LME:
sudo systemctl stop lme.service -
To start LME:
sudo systemctl restart lme.service