ElastAlert2 Rule Writing
This page explains how to write and implement alert rules using ElastAlert2, enabling real-time notifications for detections and alerts triggered by Elasticsearch and Wazuh.
By default, all logs and detections are indexed in Elasticsearch. However, in many cases, you may also want to push notifications to your team through tools like Slack, Microsoft Teams, email, and more. ElastAlert2 supports this through a wide range of alerting integrations. View the full list of supported alert types here.
Alert Rule Overview
Below is an example rule that triggers when Windows Event Logs are cleared, a default detection included in Logging Made Easy (LME).
We’ll break down each component of the rule to help you understand how it works. You can use this format as a starting point for your own custom rules. We also welcome community contributions to expand the available rule set in future releases.
name: Windows Event Logs Cleared

# Type of rule
type: any

# Index pattern to search another example could be wazuh-*
index: logs-*

# Elasticsearch query in DSL format
filter:
  - query:
      bool:
        must:
          - terms:
              event.action: ["audit-log-cleared", "Log clear"]
          - term:
              winlog.api: "wineventlog"
        must_not:
          - term:
              winlog.provider_name: "AD FS Auditing"

# Alert when conditions are met
alert:
  - "slack"

# Slack alert details
slack_webhook_url: "https://hooks.slack.com/services/EXAMPLE" # This is an example webhook to slack

# Alert message format
alert_text: |
  Windows Event Logs Cleared Detected!
  Host: {0}
  Event Action: {1}
  Winlog Provider Name: {2}
  Timestamp: {3}
alert_text_args:
  - host.name
  - event.action
  - winlog.provider_name
  - "@timestamp"

# Alert text only, without additional metadata
alert_text_type: alert_text_only

# Frequency for querying Elasticsearch
realert:
  minutes: 5

# Optional timestamp field to use for events
timestamp_field: "@timestamp"
Rule Name and Type
name: Specifies the name of the rule; in this case, detects when Windows Event Logs are cleared.
type: Set to any, which means the rule will trigger for any matching event, regardless of how often it occurs.
name: Windows Event Logs Cleared
type: any
Index Pattern
index: Defines which Elasticsearch index to search.
- The pattern
logs-*typically includes all log data indexed by Elastic - You can adjust this pattern to target specific indices, such as wazuh-*, depending on your setup
index: logs-*- The pattern
Filter Conditions
This section defines the conditions required to trigger the alert:
- The
event.actionmust be either “audit-log-cleared” or “Log clear” - The
winlog.apimust be “wineventlog” - The
winlog.provider_namemust not be “AD FS Auditing” (to exclude legitimate log clearing events from Active Directory Federation Services [AD FS])
- The
Some useful guidance for writing filters can be found in Elastic’s Query DSL documentation.
We also recommend exploring Generative Pre-trained Transformer (GPT) model tools or the official documentation when constructing these queries. We’ve found that AI tools often generate good baseline templates that can be easily modified.
filter:
  - query:
      bool:
        must:
          - terms:
              event.action: ["audit-log-cleared", "Log clear"]
          - term:
              winlog.api: "wineventlog"
        must_not:
          - term:
              winlog.provider_name: "AD FS Auditing"
Alert Configuration
This section defines how alerts are delivered (e.g., email, slack).
In this example, alerst are sent to Slack.
For full details on alerting options, reference the official ElastAlert2 documentation.
alert:
  - "slack"

slack_webhook_url: "https://hooks.slack.com/services/EXAMPLE" # This is an example webhook to slack
Alert Message Format
This section defines the content and format of the alert message:
- A warning message
- The name of the host where the event occurred
- The specific event action
- The Windows log provider name
- The timestamp of the event
The
alert_text_typeis set toalert_text_only, which means only the custom text you define will appear in the alert–no extra metadata is included.The placeholders in
alert_test_argscorrespond to fields in the event JSON; for example:- {0} will be replaced with the host name
- {1} will be replaced with the event action
- {2} will be replaced with the provider’s name
- {3} will be replaced with the timtestamp
These fields can be reviewed in Kibana if you want to identify or pull additional fields into your alert text.
alert_text: |
  Windows Event Logs Cleared Detected!
  Host: {0}
  Event Action: {1}
  Winlog Provider Name: {2}
  Timestamp: {3}
alert_text_args:
  - host.name
  - event.action
  - winlog.provider_name
  - "@timestamp"

alert_text_type: alert_text_only
Alert Frequency
This setting prevents alert fatigue by suppressing duplicate alerts for 5 minutes after one is sent. After 5 minutes, ElastAlert2 will trigger again but only for new events.
realert:
  minutes: 5
Timestamp Field
This specifies that the rule should use the “@timestamp” field to determine the time of events.
timestamp_field: "@timestamp"
Rule Storage
Before ElastAlert2 can use your rule, you must save it to the correct directory. ElastAlert2 expects rule files to be stored in a specific file structure.
ElastAlert2 uses the following directories:
root@ubuntu:~# tree /opt/lme/config/elastalert2/
/opt/lme/config/elastalert2/
├── config.yaml
├── misc
│   └── smtp_auth.yml
└── rules
├── example-email-rule.yml
   └── windows_event_logs_cleared.yaml
/opt/lme/config/elastalert2/misc/: For miscellaneous files required by specific alert types (e.g., smtp alerts require a smtp_auth.yml file like we’ve included as an example)./opt/lme/config/elastalert2/rules/: Where you place your ElastAlert2 rule .yaml files./opt/lme/config/elastalert2/config.yaml: The main configuration file for ElastAlert2. Reference the ElastAlert2 documentation for additional options.
Any changes to the above files will require a container restart for them to apply to the ElastAlert2 service.
Important: Restart the ElastAlert2 container only after verifying your rule in the next section.
Test and Deploy the Rule
After writing the rule, use the following command to test it:
podman run -it --rm --net lme --env-file=/opt/lme/lme-environment.env -e ES_HOST=lme-elasticsearch -e ES_PORT=9200 -e ES_USERNAME=elastic --secret elastic,type=env,target=ES_PASSWORD\
-v /opt/lme/config/elastalert2/config.yaml:/opt/elastalert/config.yaml -v /opt/lme/config/elastalert2/rules:/opt/elastalert/rules -v /opt/lme/config/elastalert2/misc:/opt/elastalert/misc\
--entrypoint elastalert-test-rule localhost/elastalert2:LME_LATEST /opt/elastalert/rules/example-email-rule.yml
We’ve wrapped the above command into a bash script:
cd ~/LME/
./scripts/elastalert-test.sh example-email-rule.yml
The input value is the filename of your rules saved to the rules directory at
/opt/lme/config/elastalert2/rules/.The command runs the `elastalert-test-rule tool using the specified config and rule files to validate your alert before deploying it live.
IMPORTANT: Ensure the rule evaluates and runs successfully before adding it into ElastAlert2, as ElastAlert2 will crash if the rule cannot be successfully parsed.
ElastAlert2 Error and Status Logs
You can find ElastAlert2 logs in the lme_elastalert2_logs volume:
sudo -i
podman volume mount lme_elastalert2_logs
cd /var/lib/containers/storage/volumes/lme_elastalert2_logs/_data
You can also check ElastAlert2 errors and runtime status by running:
sudo -i podman logs lme-elastalert
Additionally, logs written by Elasticsearch can be viewed in Kibana under the elastalert_* index pattern.
To view these logs in Discover:
- Click on the Discover tab.
- Click on the blue drop-down menu to manage data view.
- Select Create a data view.
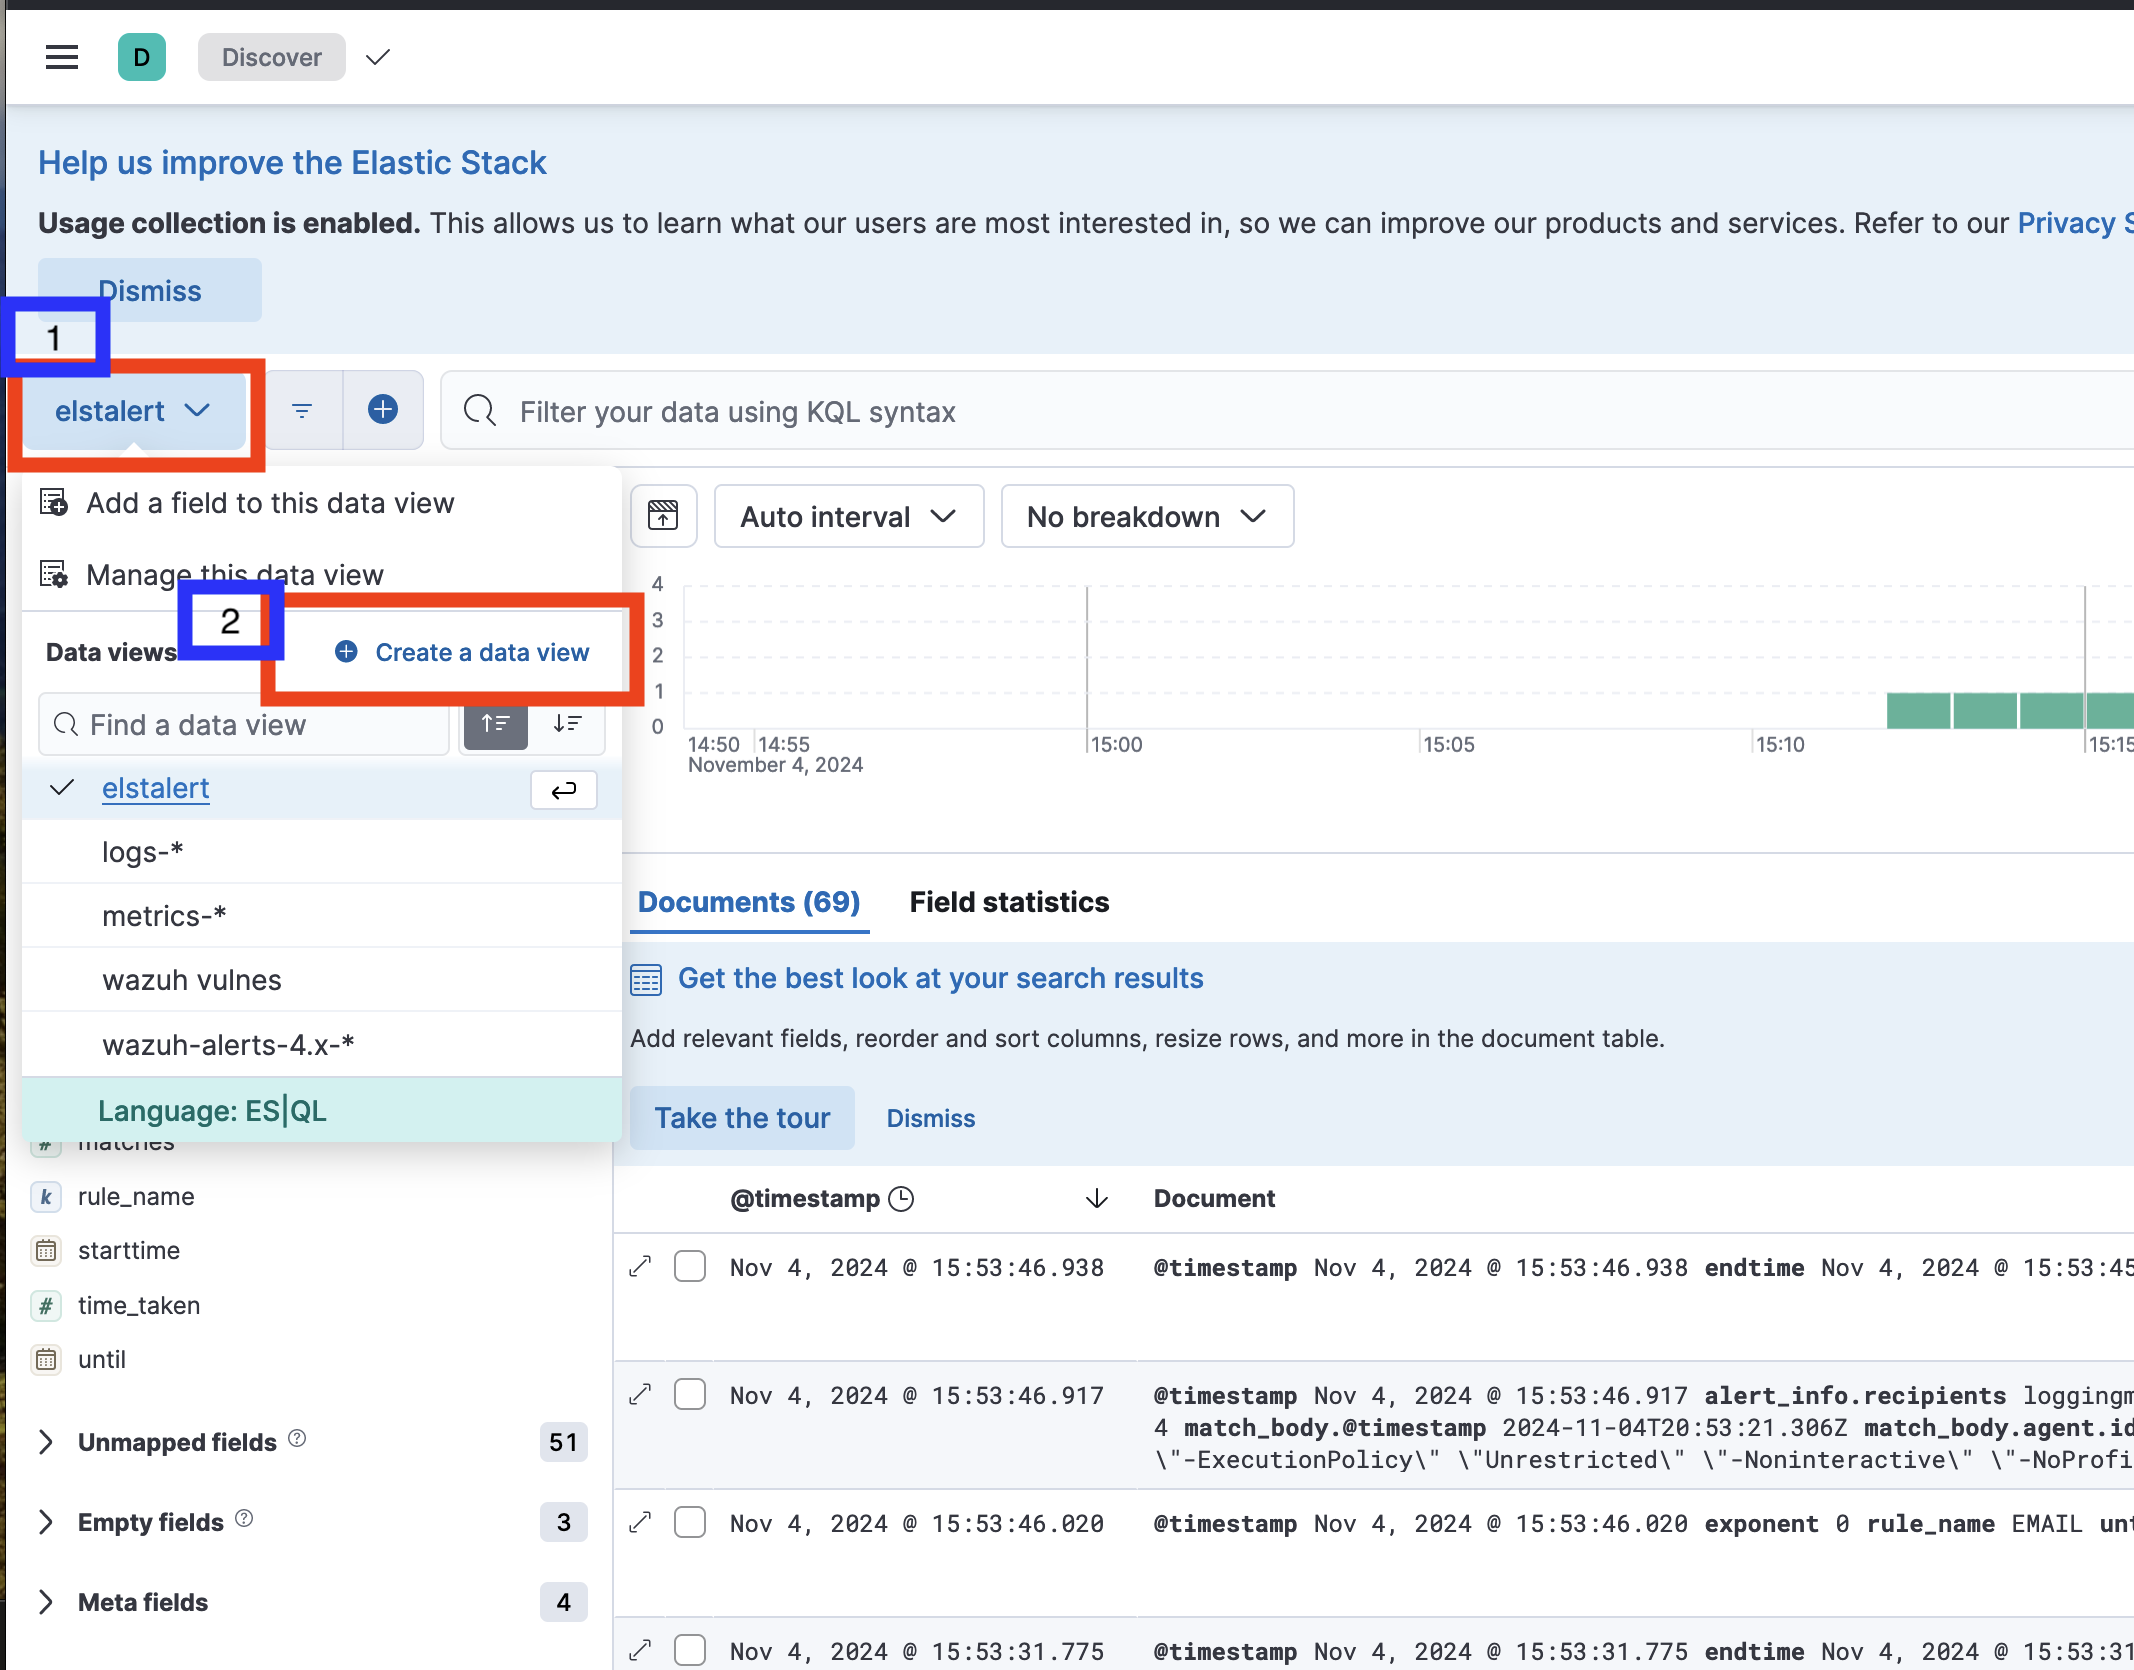
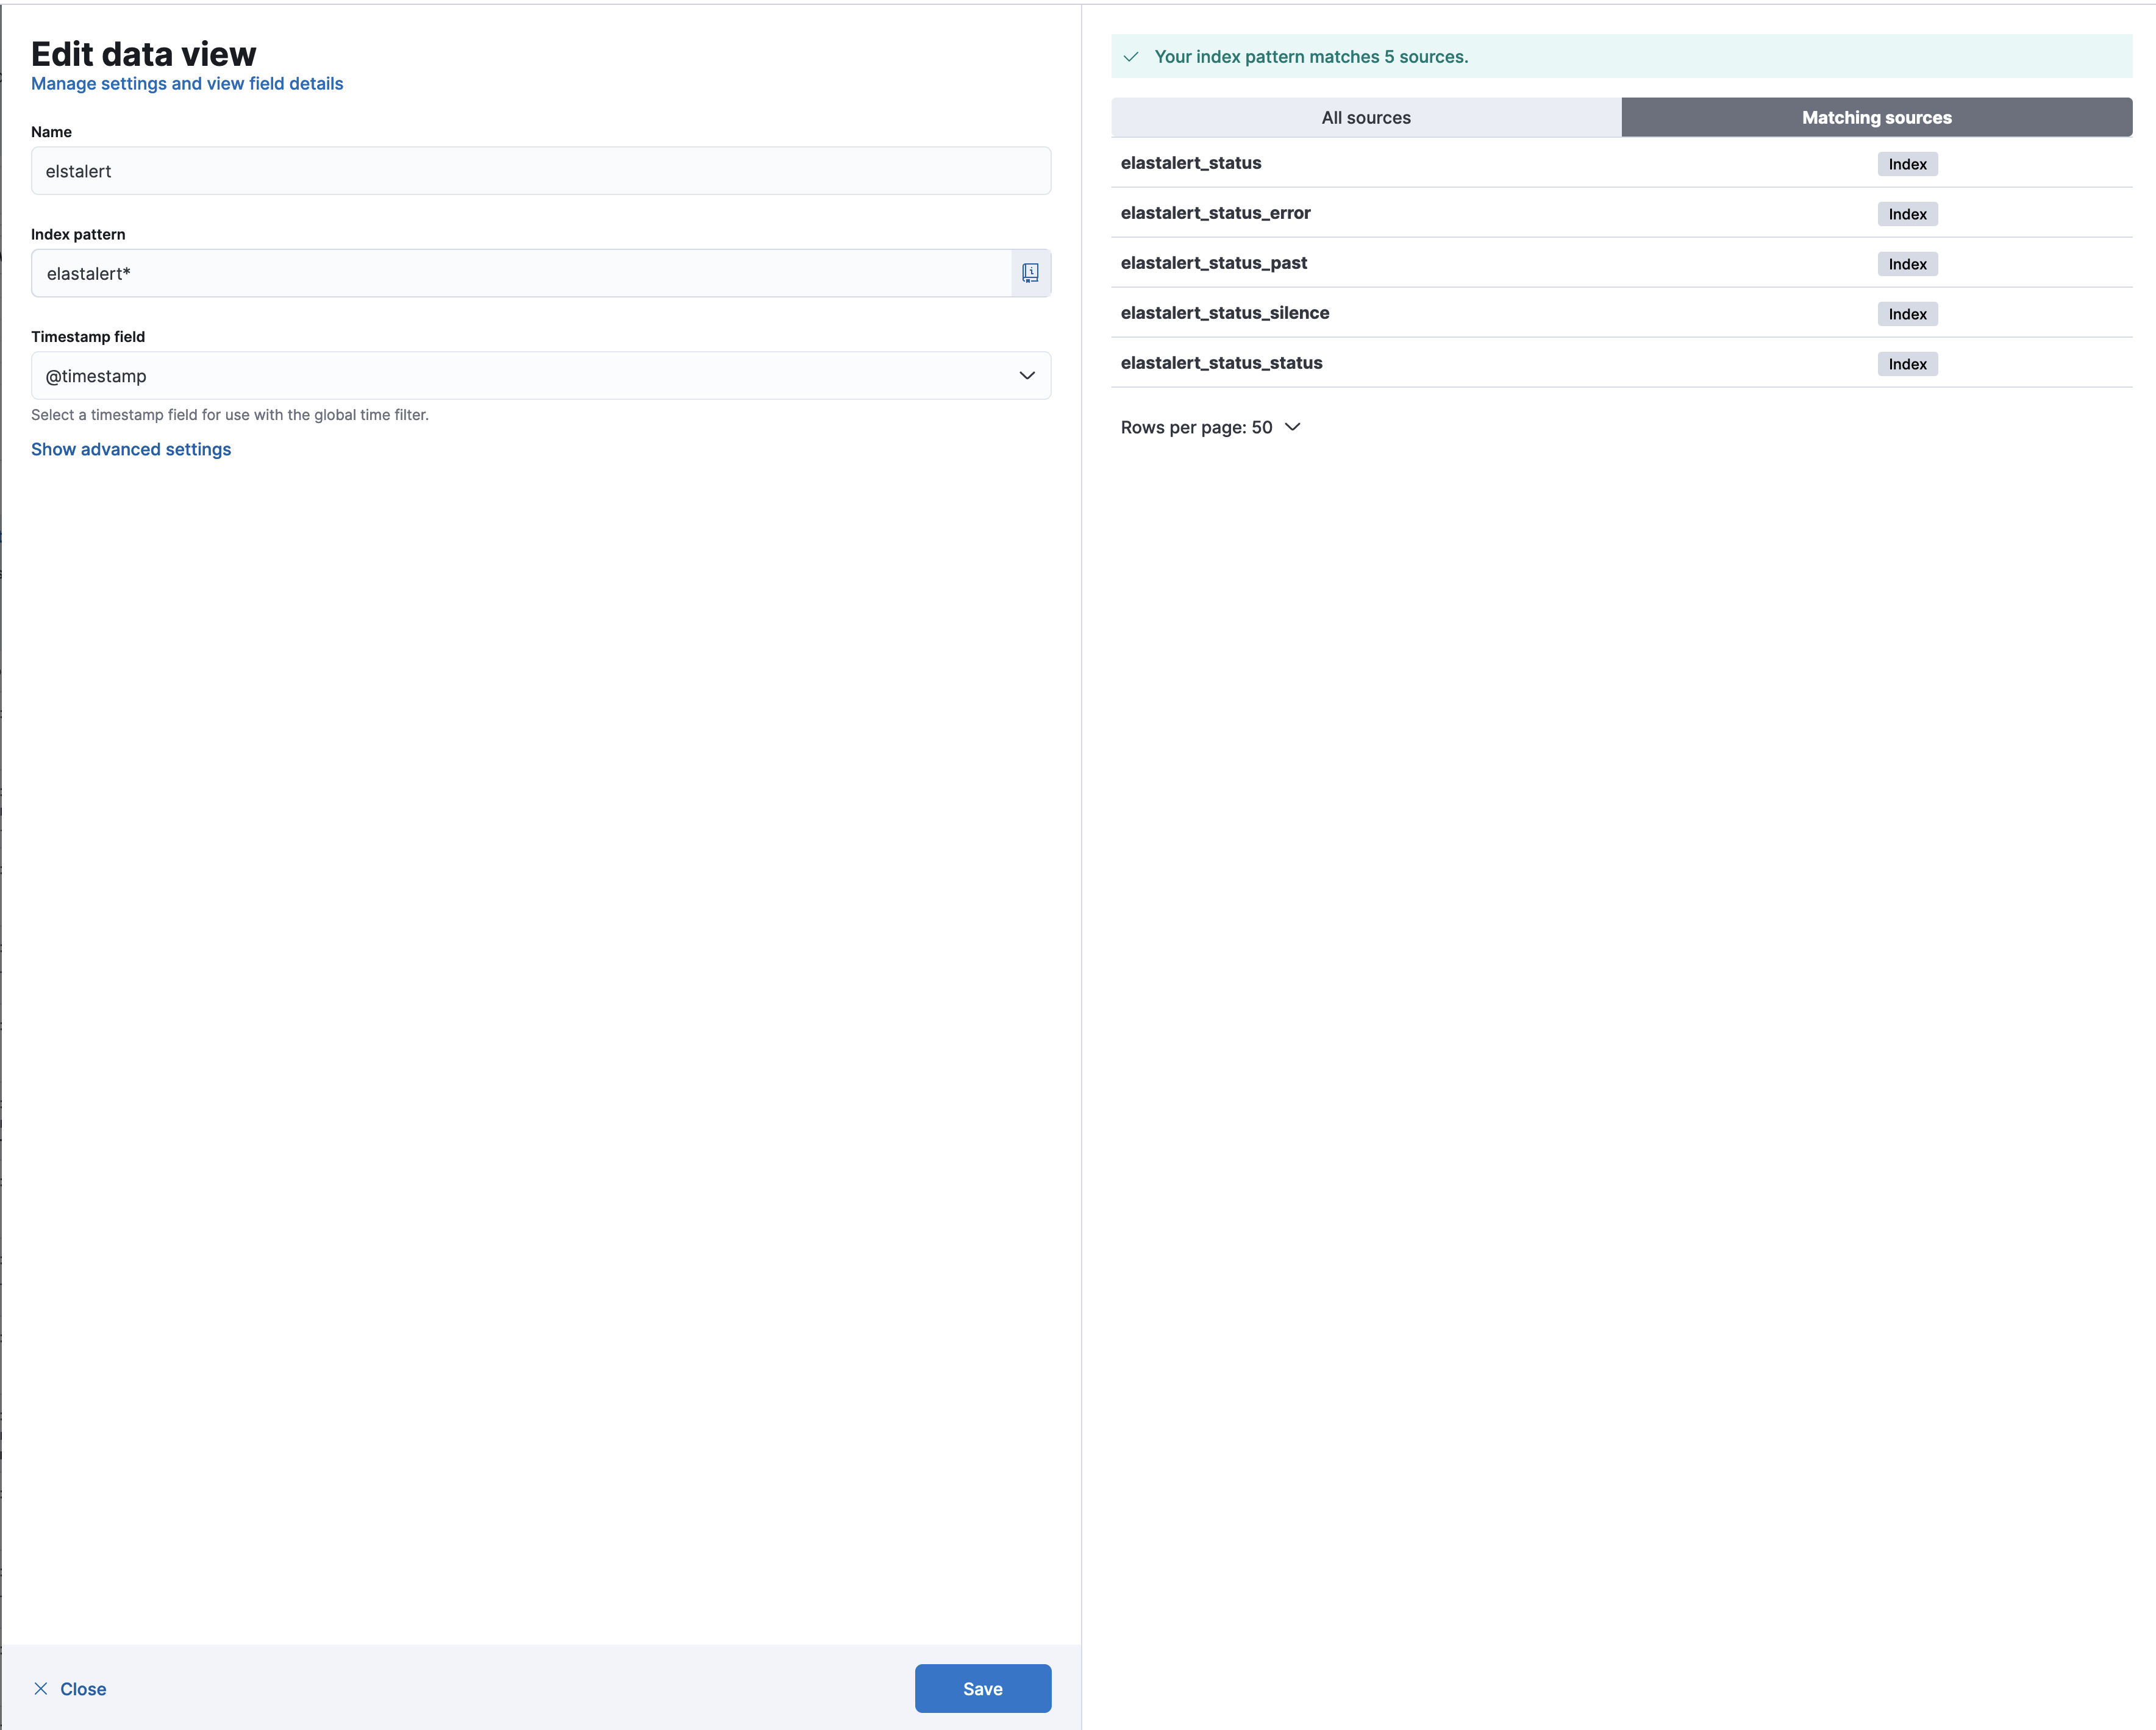
- Set the name (we recommend
elastalert). - Set the index pattern to match:
elastalert* - Click on the Save button.
Using Email and SMTP
ElastAlert2 supports email alerts via Simple Mail Transfer Protocol (SMTP). We’ve included an example SMTP rule to help you configure this feature.
Note: ElastAlert2 does not support Open Authorization (OAuth) or modern authentication. You must use a standard username/password email configuration for sending alerts.
Gmail users can use an app password to generate a password for this purpose. Outlook and other email providers have similar options. We recommend using a dedicated email account for alerting purposes only.
You can follow Google’s instructions here and should see a screen similar to this:
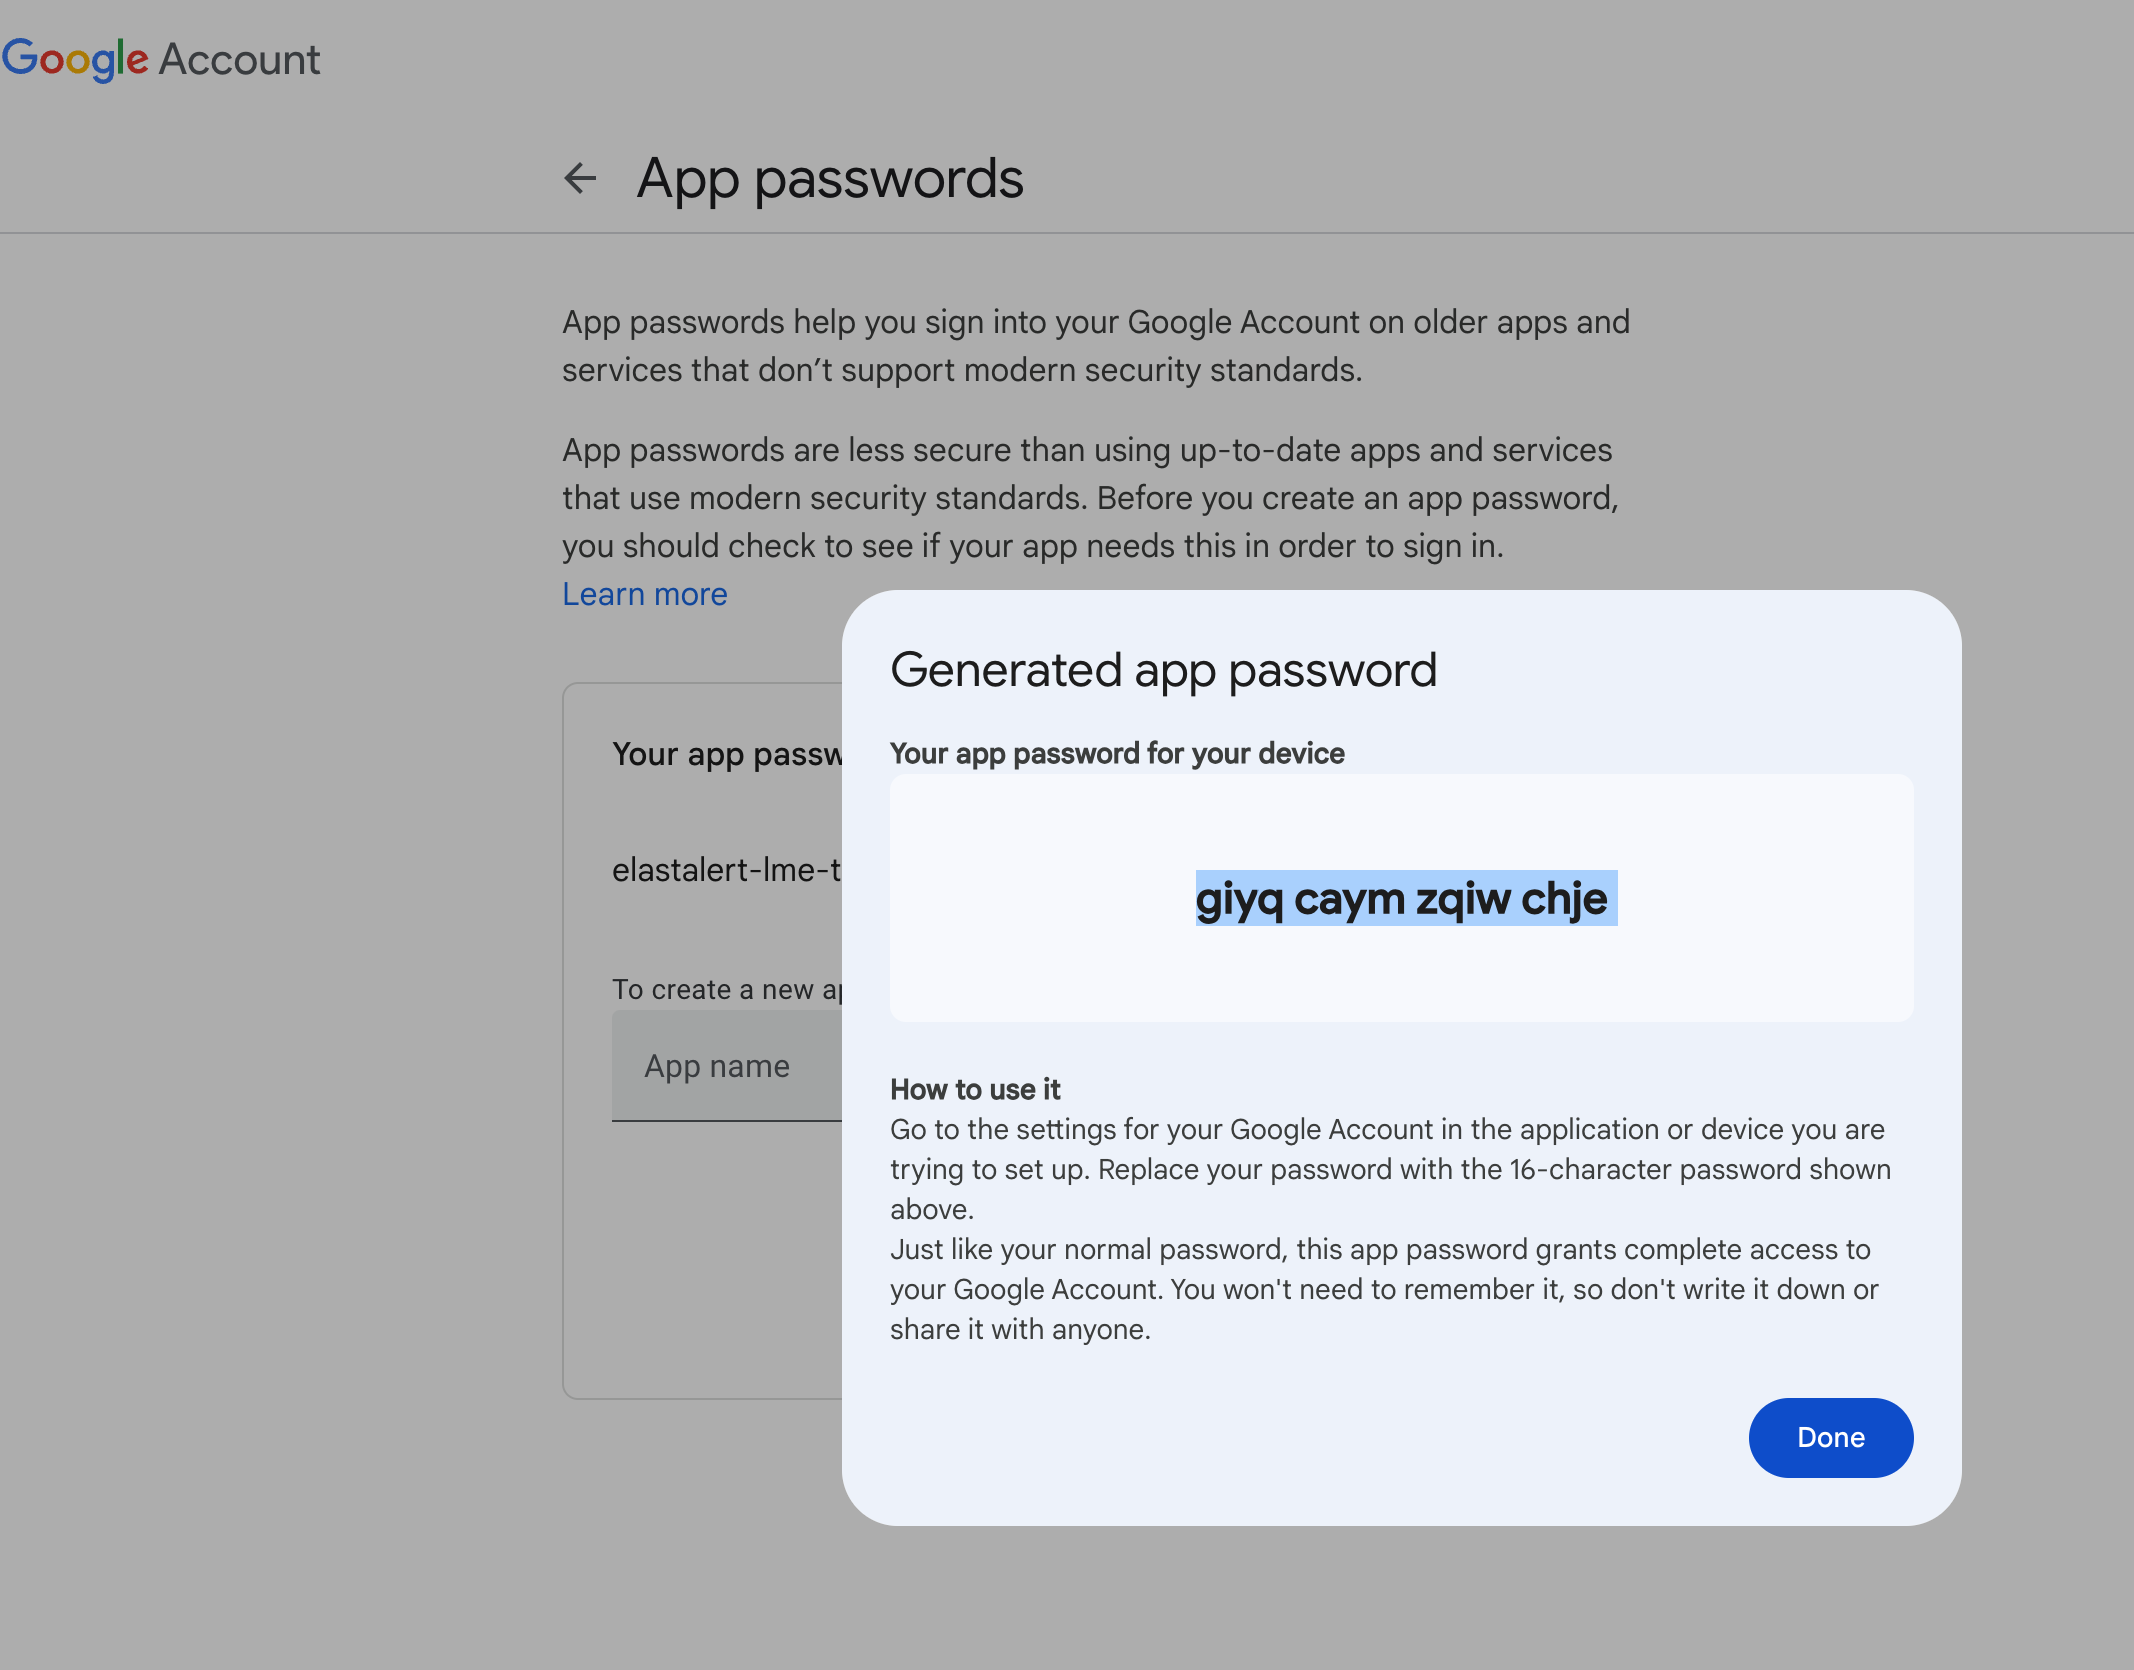
Once you’ve created your credentials, place your email rule and SMTP credentials file in the appropriate directories.
Example directory structure:
root@ubuntu:/opt/lme/config/elastalert2# tree
.
├── misc
│   └── smtp_auth.yml
└── rules
    ├── example-email-rule.yml
SMTP_AUTH.yml
This file contains your email credentials. Ensure to store this securely and avoid committing it to version control:
---
user: "loggingmadeeasy@gmail.com"
password: "giyq caym zqiw chje"
SMTP_AUTH.yml (Rule Configuration)
This rule example sends an email alert when a specific IP phrase is matched in Wazuh logs:
name: EMAIL
type: frequency
index: wazuh-*
num_events: 1
timeframe:
  minutes: 1
filter:
- query:
    match_phrase:
      agent.ip: "10.1.0.4"
alert: email
alert_text: "ASDFASDF"
alert_text_type: alert_text_only
email:
  - "loggingmadeeasy@gmail.com"
smtp_ssl: true
smtp_port: 465
smtp_host: "smtp.gmail.com"
from_addr: "elastalert@elastalert.com"
smtp_auth_file: /opt/elastalert/misc/smtp_auth.yml
Other Options
Reference ElastAlert2 documentation for more examples and guidance on tailoring alerts to fit your organization’s needs.